
Analytics
Analytics counts over every project you are in at once — or the ones you pick — for a period you choose. Open it with Analytics in the bar outside a project, beside Projects (Navigation), or at beta.plune.ai/analytics.
What the page shows
Section titled “What the page shows”Every project you are a member of, in any role — owner, member or reader. The page only reads: it changes nothing in any project, and it shows no number you would not get by opening your projects one by one and adding them up. What it shows is numbers and a row per project; the runs, cases and results themselves stay in each project, and a row of the table leads there.
A project is left out when you are not a member of it, or when it is in the Bin. To see one, its owner adds you — see Members.
With an API token, only the token’s own project is read — see Through the API.
Filters
Section titled “Filters”Filters narrow what the page counts. Between filters it is and; within one, any of its values — as on the cases list. Wider than 1024 px, the head holds Date, Projects and Filters; at 1024 px and narrower only Filters is left. Date and Projects are also the first two sections of its drawer, at any width.
Last 7 days, Last 30 days, Last 90 days or All time — a preset applies at once. The page opens on Last 30 days. For other days, set Start date and End date under Custom range and Apply; both days count, and Apply waits until the end is not before the start. Clear is all time; Cancel leaves the period as it was.
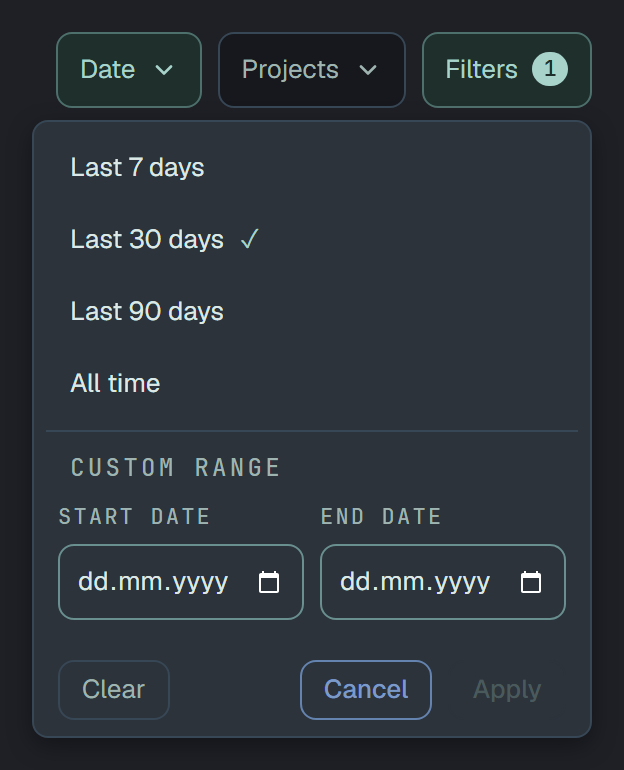
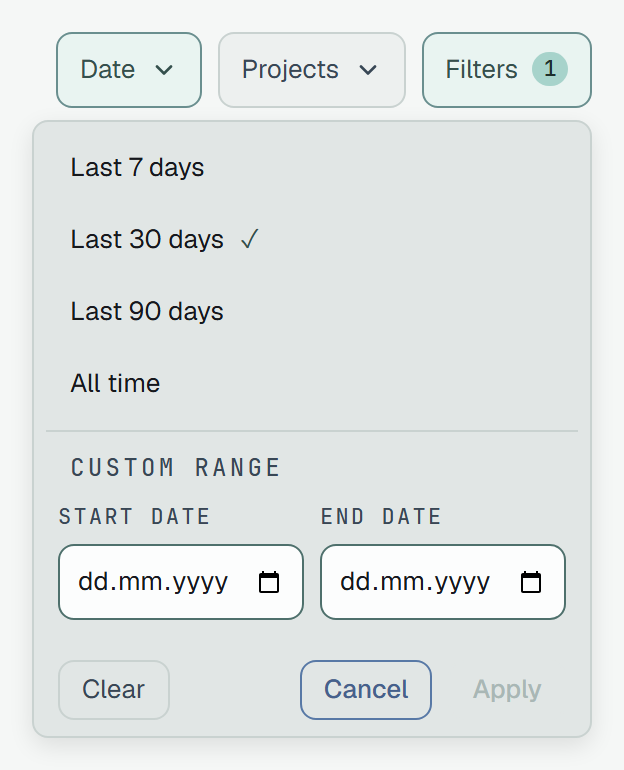
Days are your browser’s: Last 30 days is today and the 29 days before it, from the midnight that starts the first to the end of today, in your time zone.
Projects
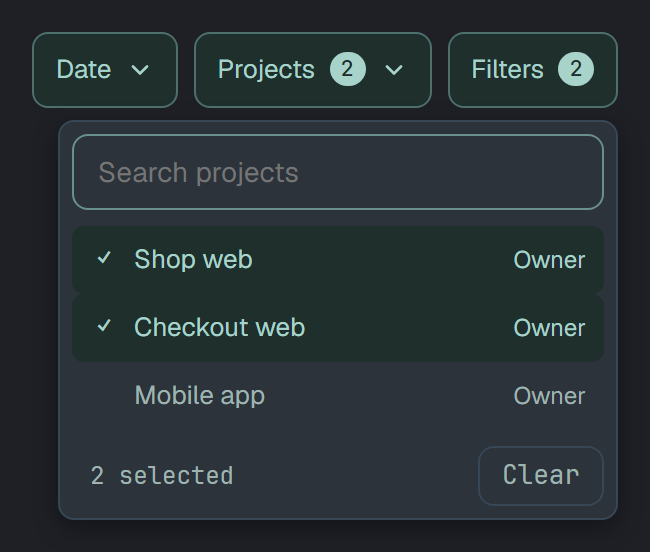
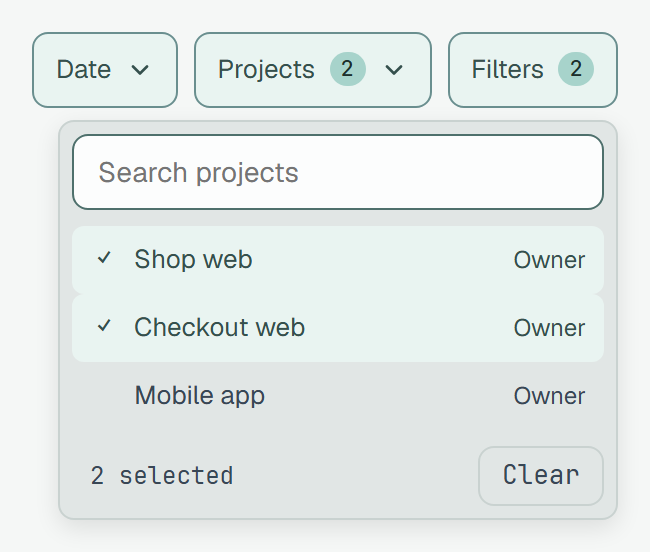
Section titled “Projects”Every project you are in, with your role in each. A tick applies at once and the list stays open for
the next one; Clear goes back to all of them. Two projects of one name — your own default and the
default of a team you were invited to — are told apart by your role here, and elsewhere by «(yours)»
after your own.
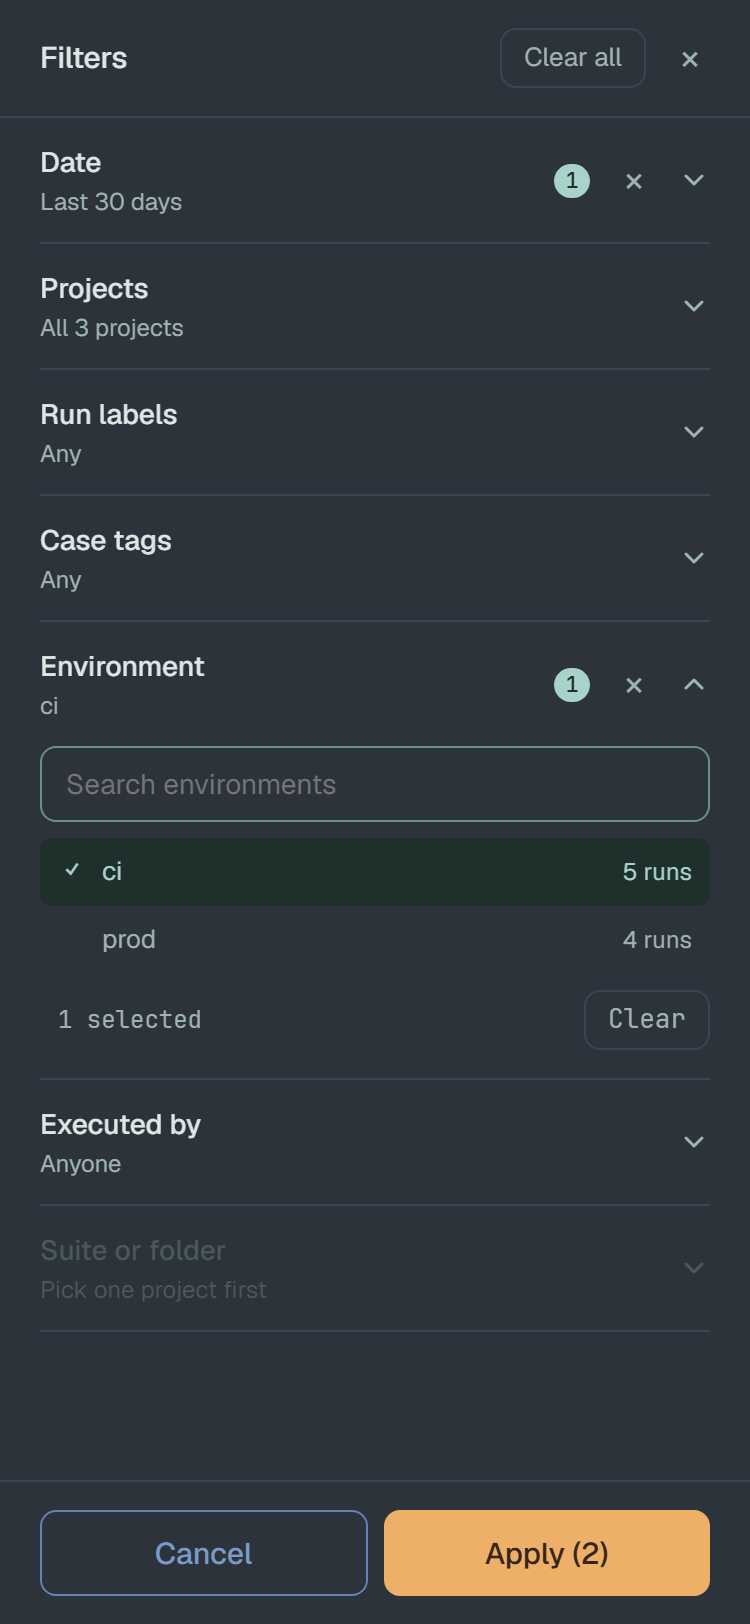
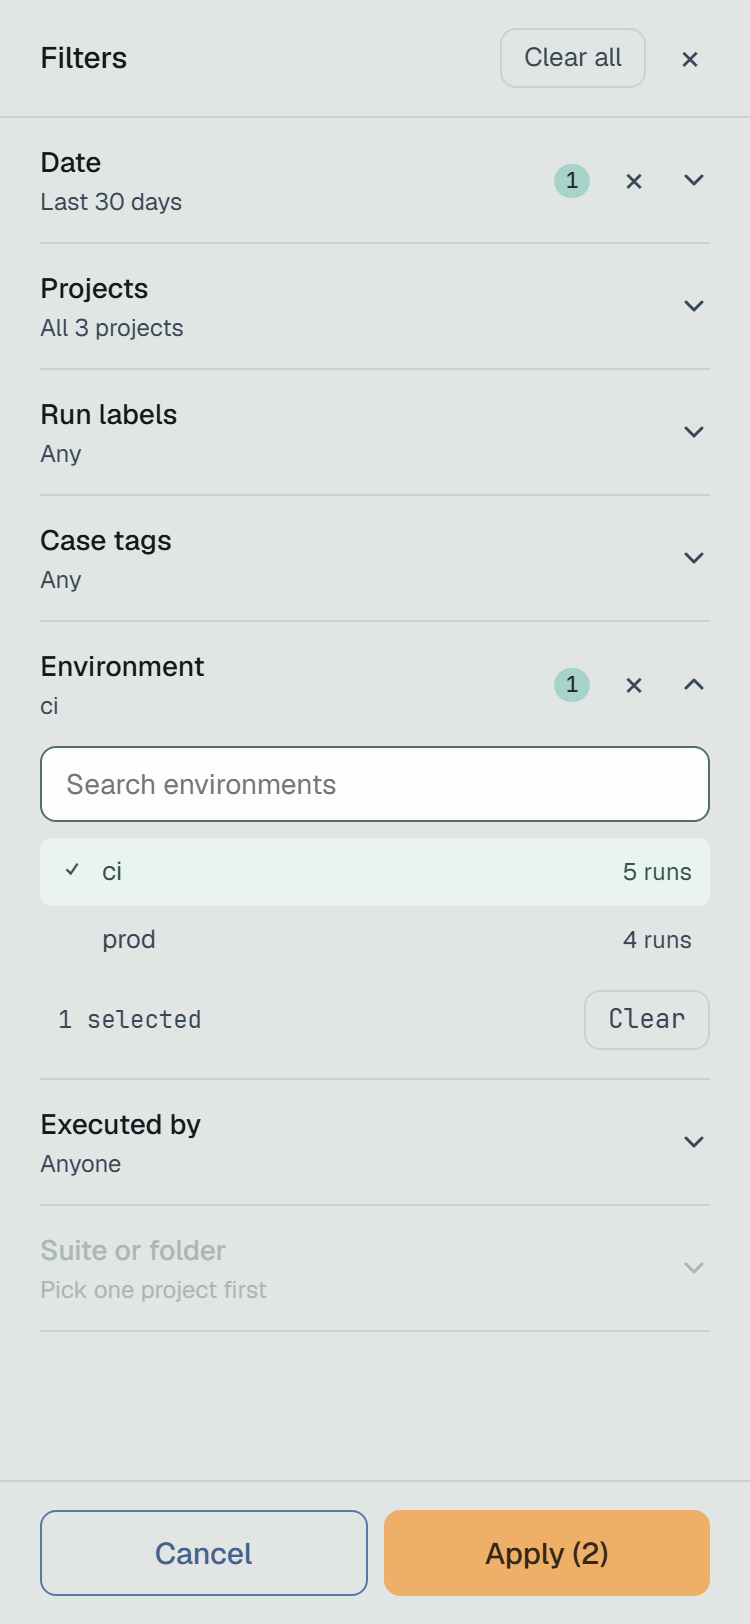
The drawer
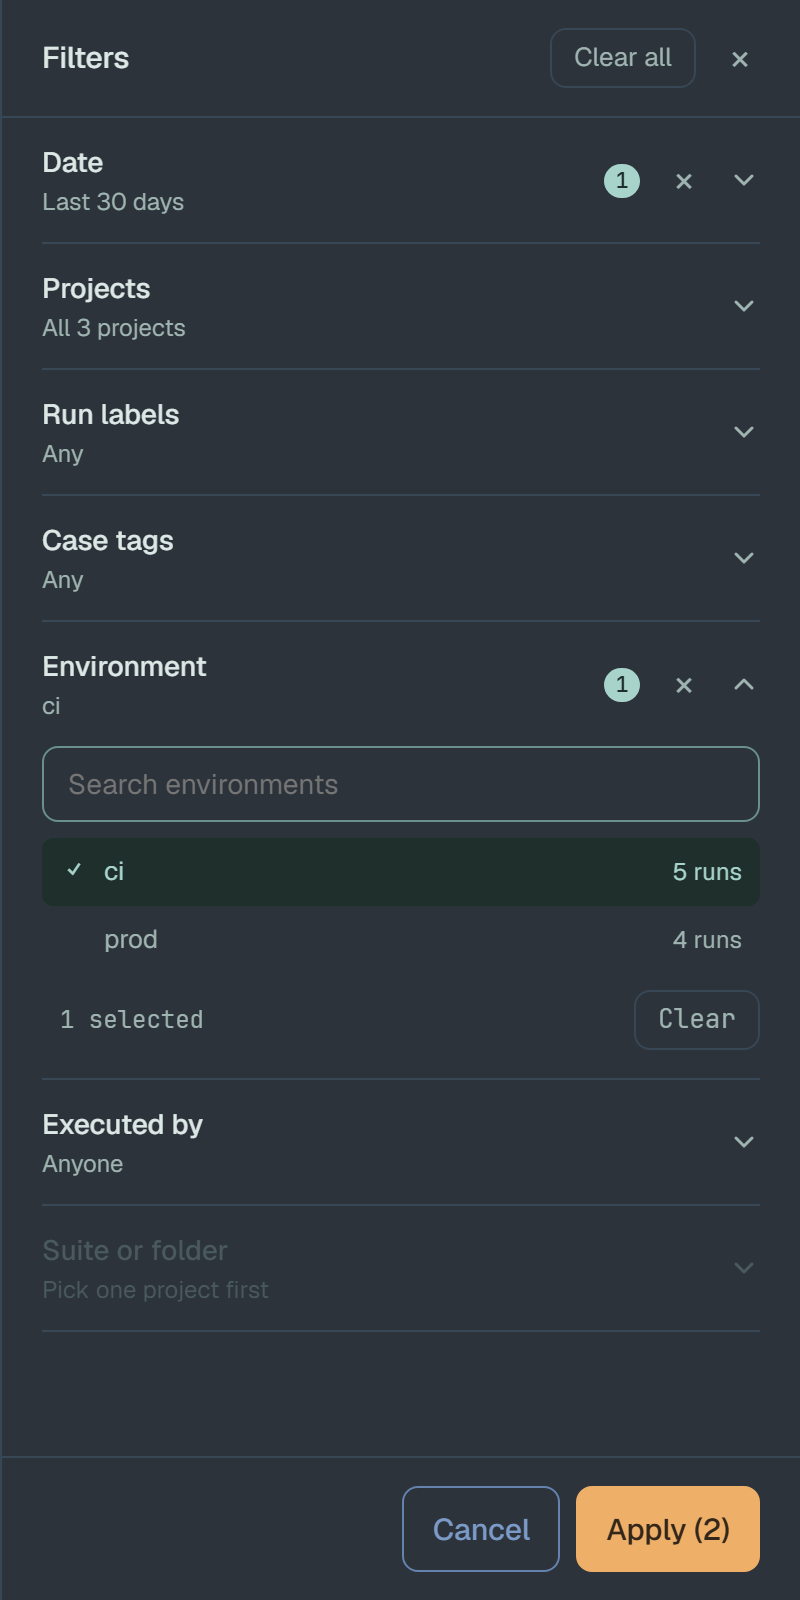
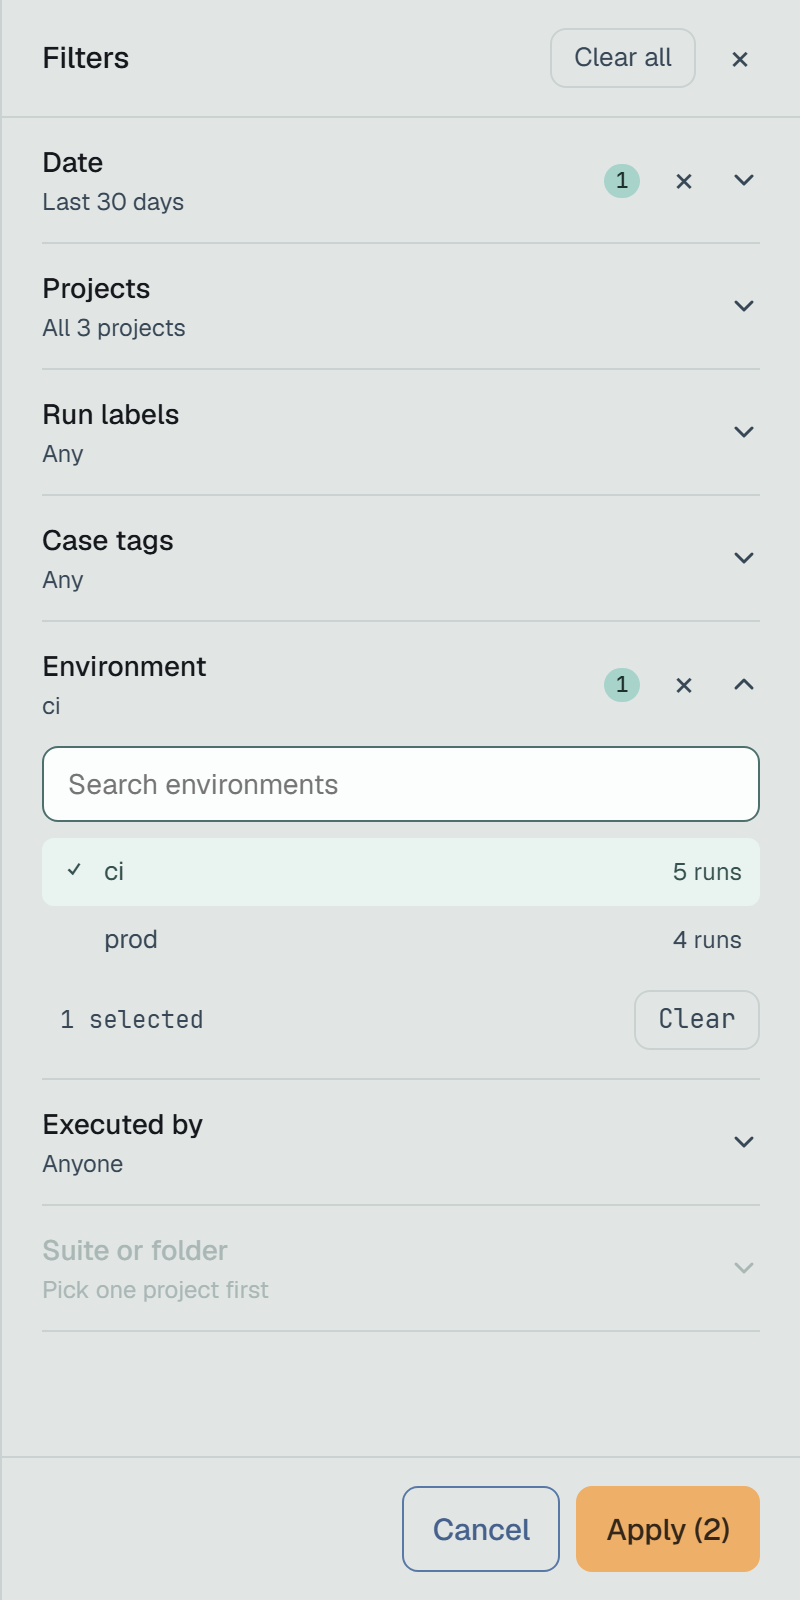
Section titled “The drawer”Filters opens a drawer on the right with every filter, a section each. The number beside Filters is how many filters are set: each counts once, however many values it holds, and the period counts too unless it is All time — so the page as it opens reads Filters (1).
The drawer works on a draft: nothing on the page changes until Apply, which says how many filters the page will then have — Apply (2). Cancel, Esc, a click beside the drawer or its × drop the draft. Under each section’s name is what it holds, with a count beside it once something is picked; × clears the section, and Clear all at the top clears the whole draft.
Beside Date and Projects, the drawer holds:
- Run labels — the labels runs were reported with, such as
nightlyorrelease, each with how many runs carry it. A run counts when it has any of the labels picked. - Case tags — the tags of cases, shown with
@, each with how many cases carry it. Tags pick cases: the page counts those cases and their results. - Environment — where a run ran, such as
ci,stagingorprod, each with its runs. - Executed by — the people of the projects. A result is a person’s when they marked it, or when nobody marked it and it belongs to a run they launched; a run counts when one of its results does.
- Suite or folder — the tree of one project, so it wakes when exactly one project is picked (Pick one project first until then). A folder takes everything beneath it. Like tags, it picks cases.
The values on offer come from the projects on the page: neither the period nor another filter shortens a list, so a value you picked stays where you can untick it. Changed Projects in the drawer? Apply, and the other lists follow the new projects.
On a phone the drawer takes the whole screen.
Chips and Clear all
Section titled “Chips and Clear all”Every filter that is set stands under the head as a chip: the period, each project, label, tag, environment, person and folder. × on a chip takes that one value off. Clear all beside the chips takes everything off — all time, every project, no filter.
A link is the filter
Section titled “A link is the filter”The page keeps its filters in its address. Each change is a step of the browser’s history, so Back returns the filters before it — and the address can be copied and sent: whoever opens it gets the same filters over their own projects.
| Key | Value |
|---|---|
period | 7d, 90d or all. The last 30 days is the address without it. |
from, to | Days, YYYY-MM-DD — a custom range, both days included. They win over period. |
projects | A project’s id. |
labels | A run label. |
tags | A case tag, without @. |
env | An environment. |
by | A person, by their user id. |
suite | A suite or folder, by its id — with exactly one project. |
A list repeats its key: projects=<id>&projects=<id>. A hand-edited address still opens a page: an
unknown period reads as the last 30 days, a range needs both days and the end not before the start,
and a suite without exactly one project is dropped.
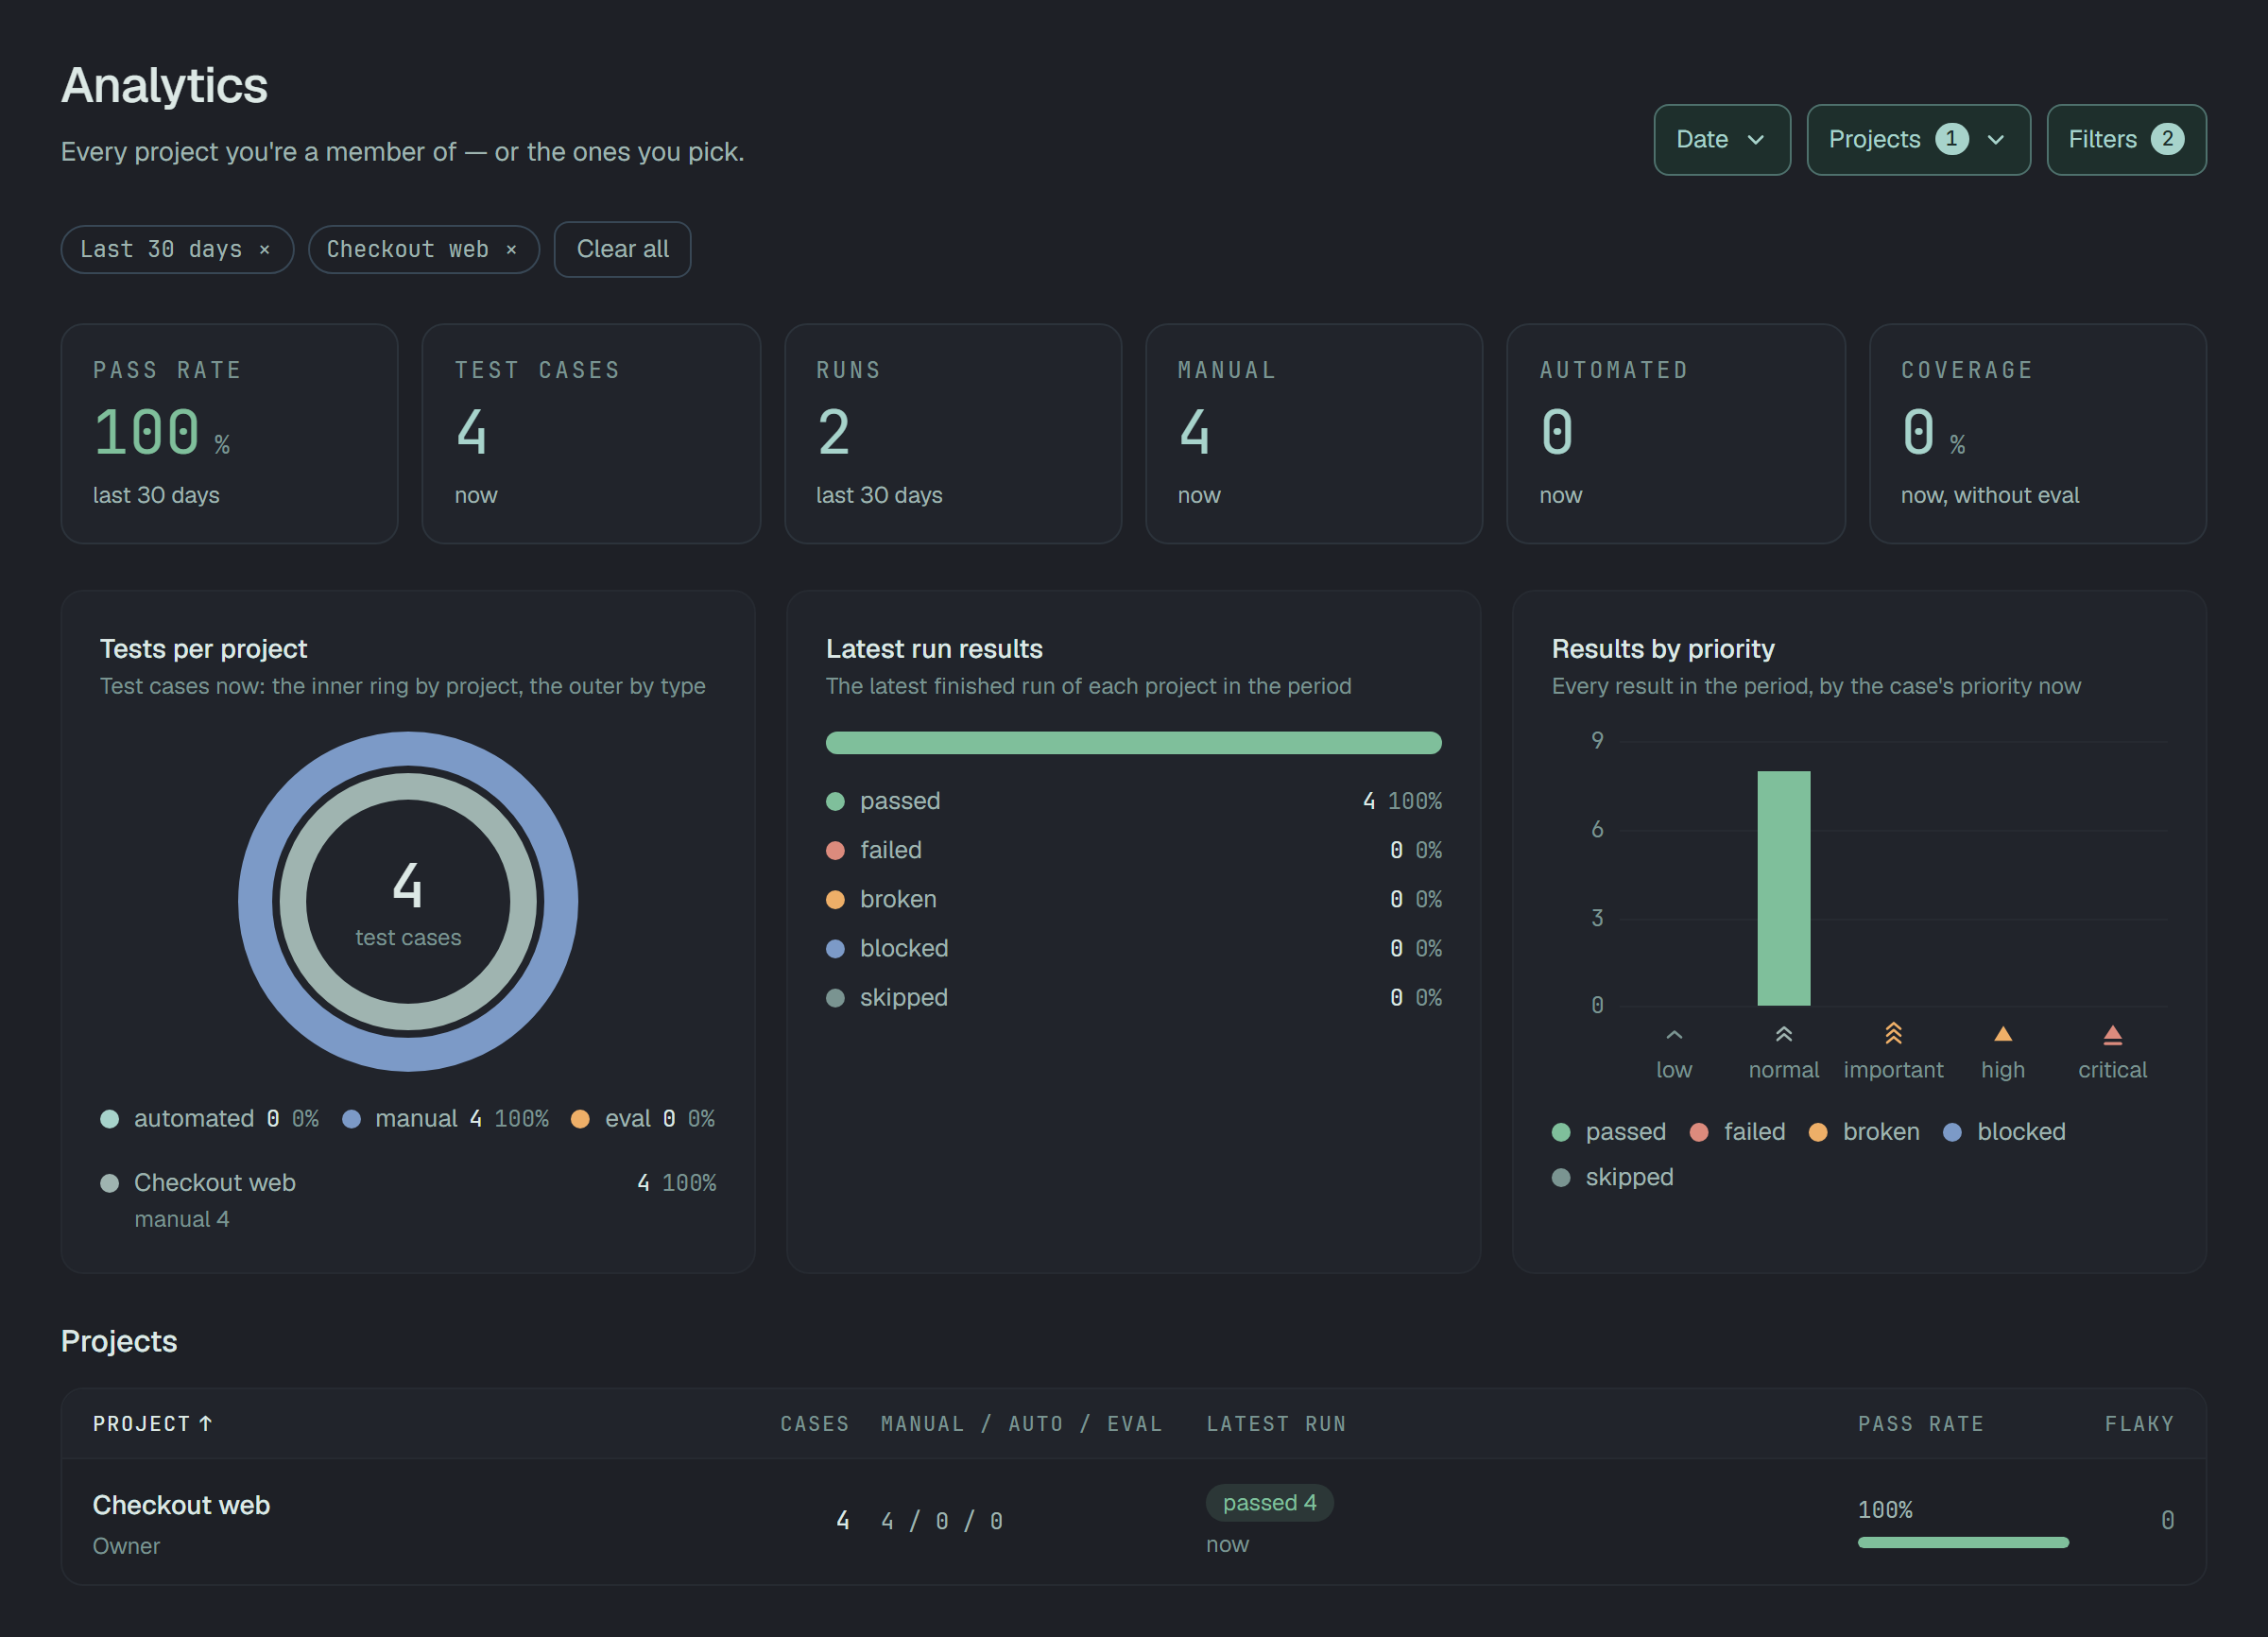
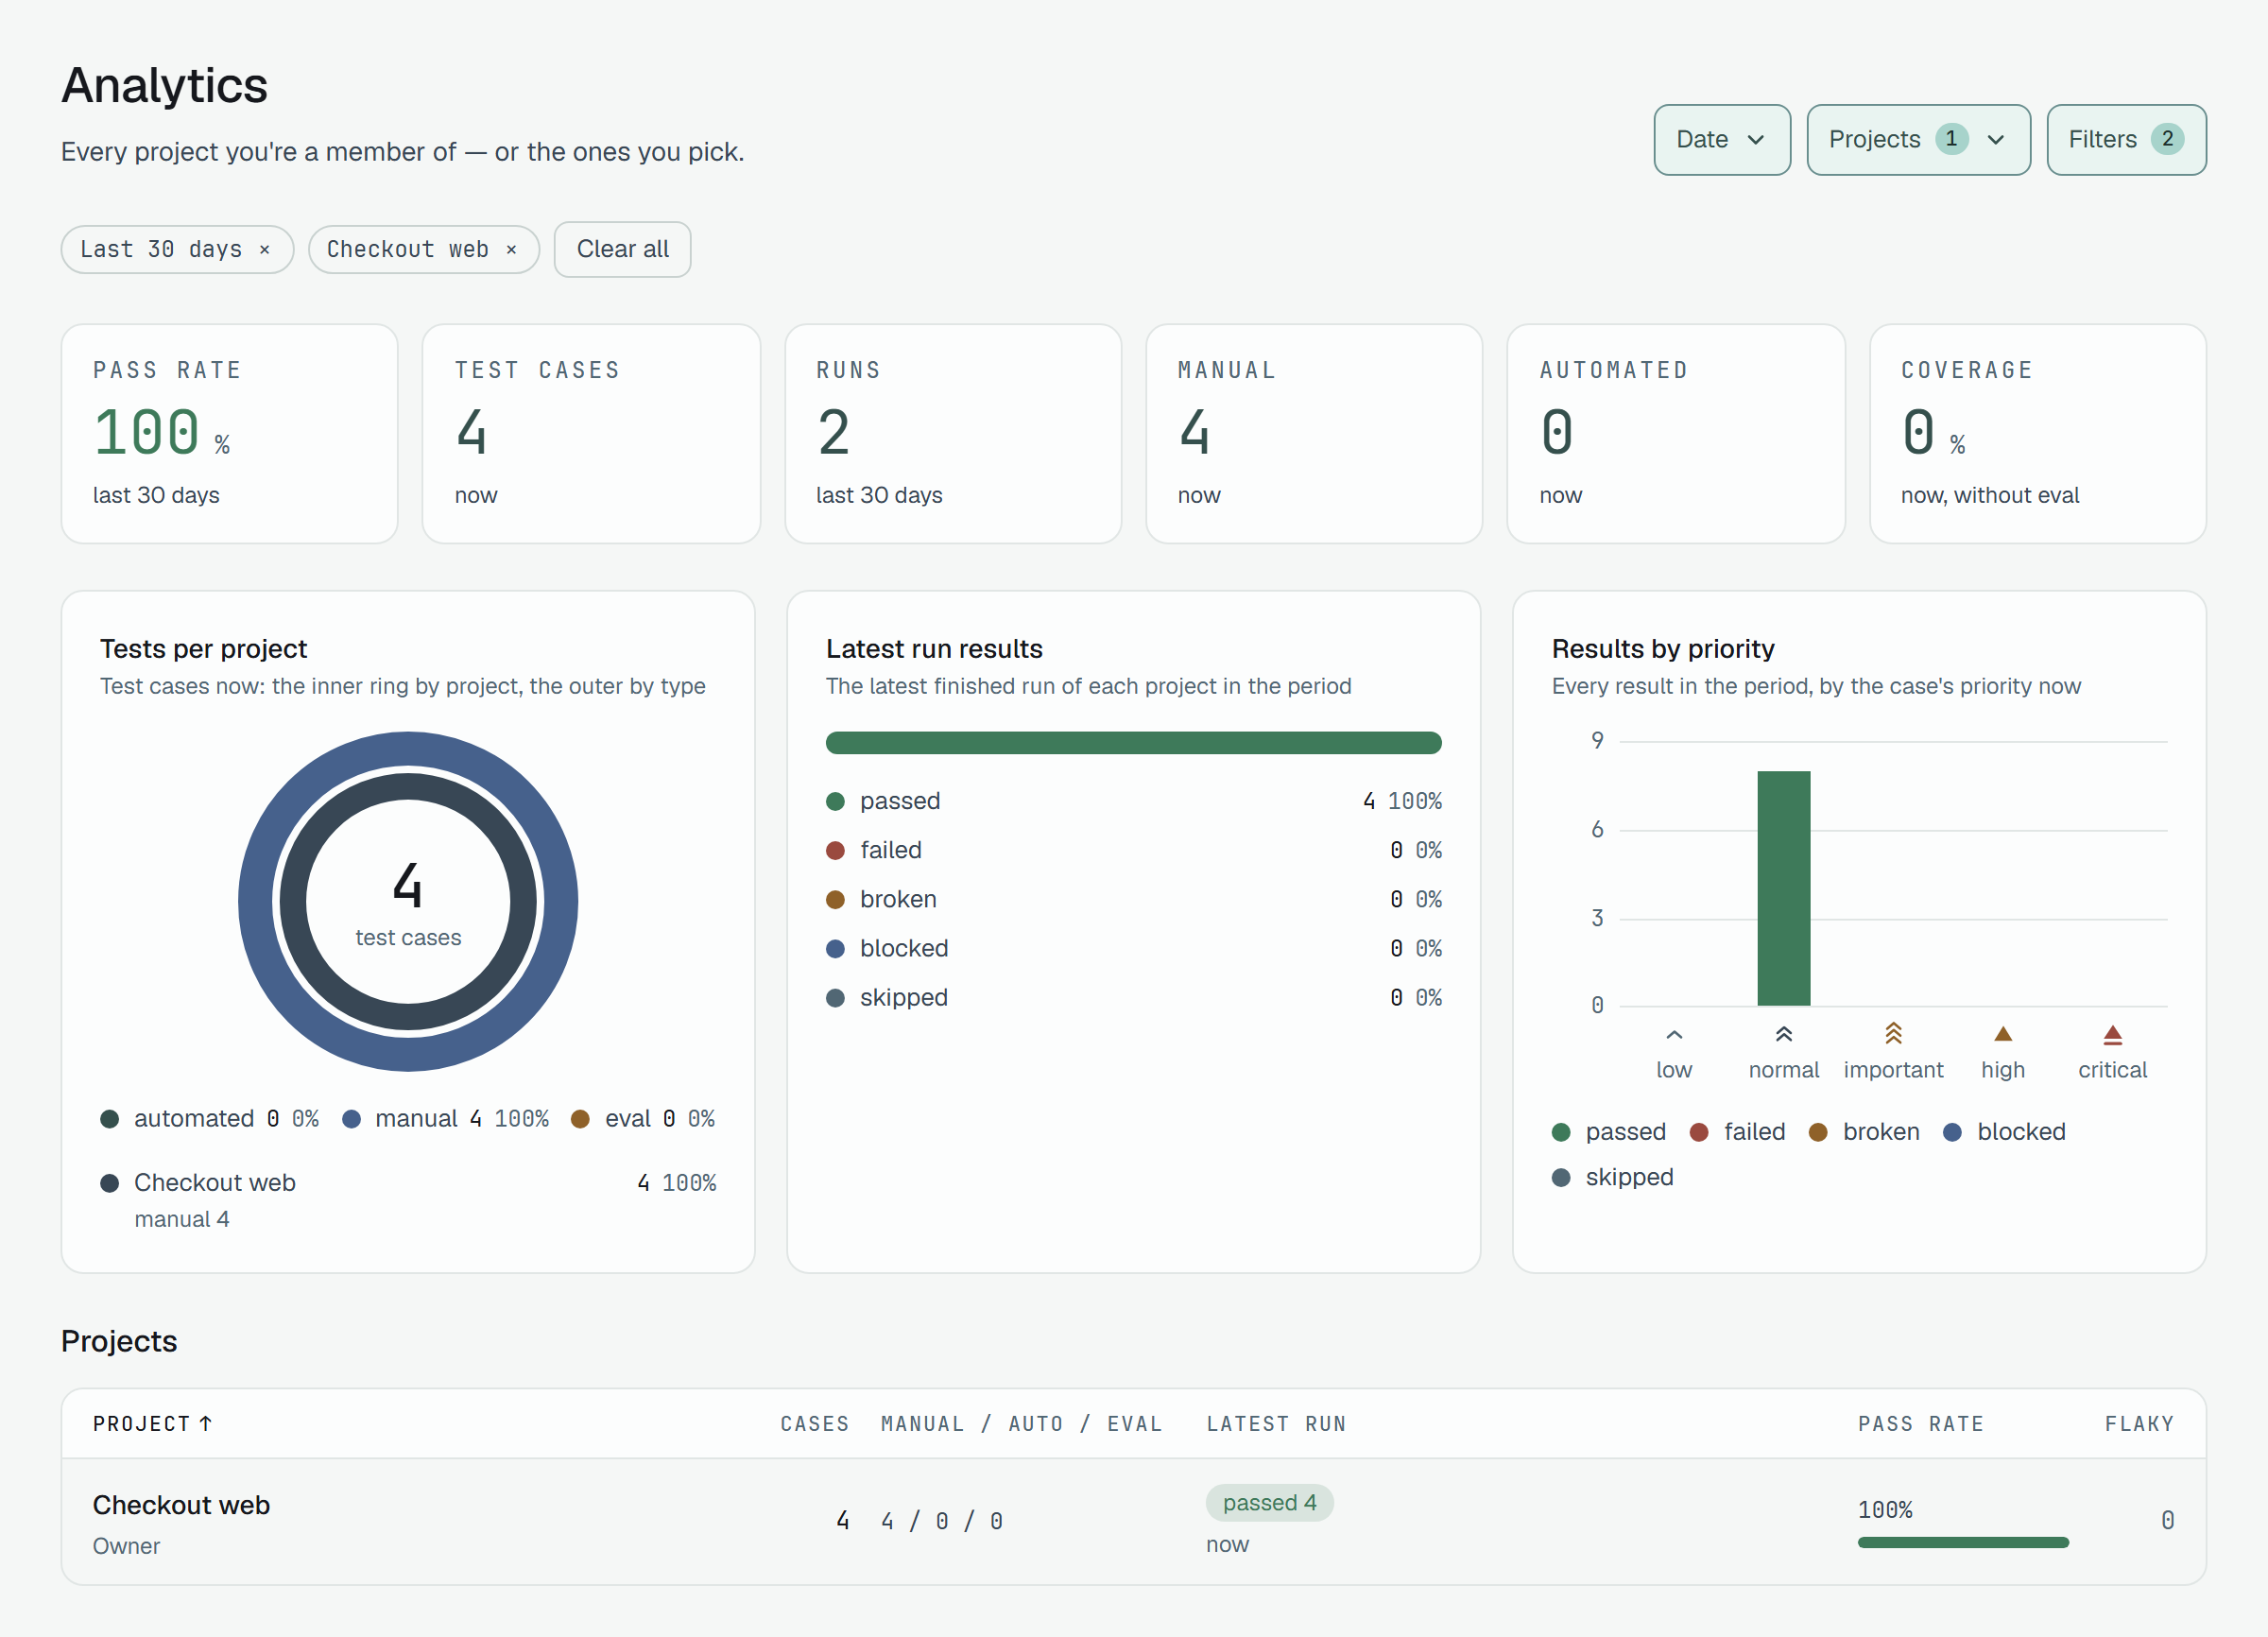
https://beta.plune.ai/analytics?period=90d&projects=<id>&projects=<id>This opens the last 90 days over those two projects, with the chips Last 90 days and the two names,
and Filters (2). A project’s id is in its own address, /projects/<id>/runs — or pick the projects
on the page and copy the address it writes. With one project, /analytics?projects=<id>, every number
is that project’s:
A link shows each person their own projects. If it names a project the one who opens it is not in, the page says «not found» in place of the numbers, as the API does; that project’s chip, which then shows its id, takes it off with ×.
When nothing matches
Section titled “When nothing matches”When a run label, case tag, environment, person or folder finds nothing in the period, the page says what, in one sentence — «No run in the last 30 days has the label release-2026-10 and a case tagged @payments. Clear a filter or pick a longer period.» — with Clear all under it. A quiet period alone is not that: it is a page of zeros and dashes, below.
The numbers
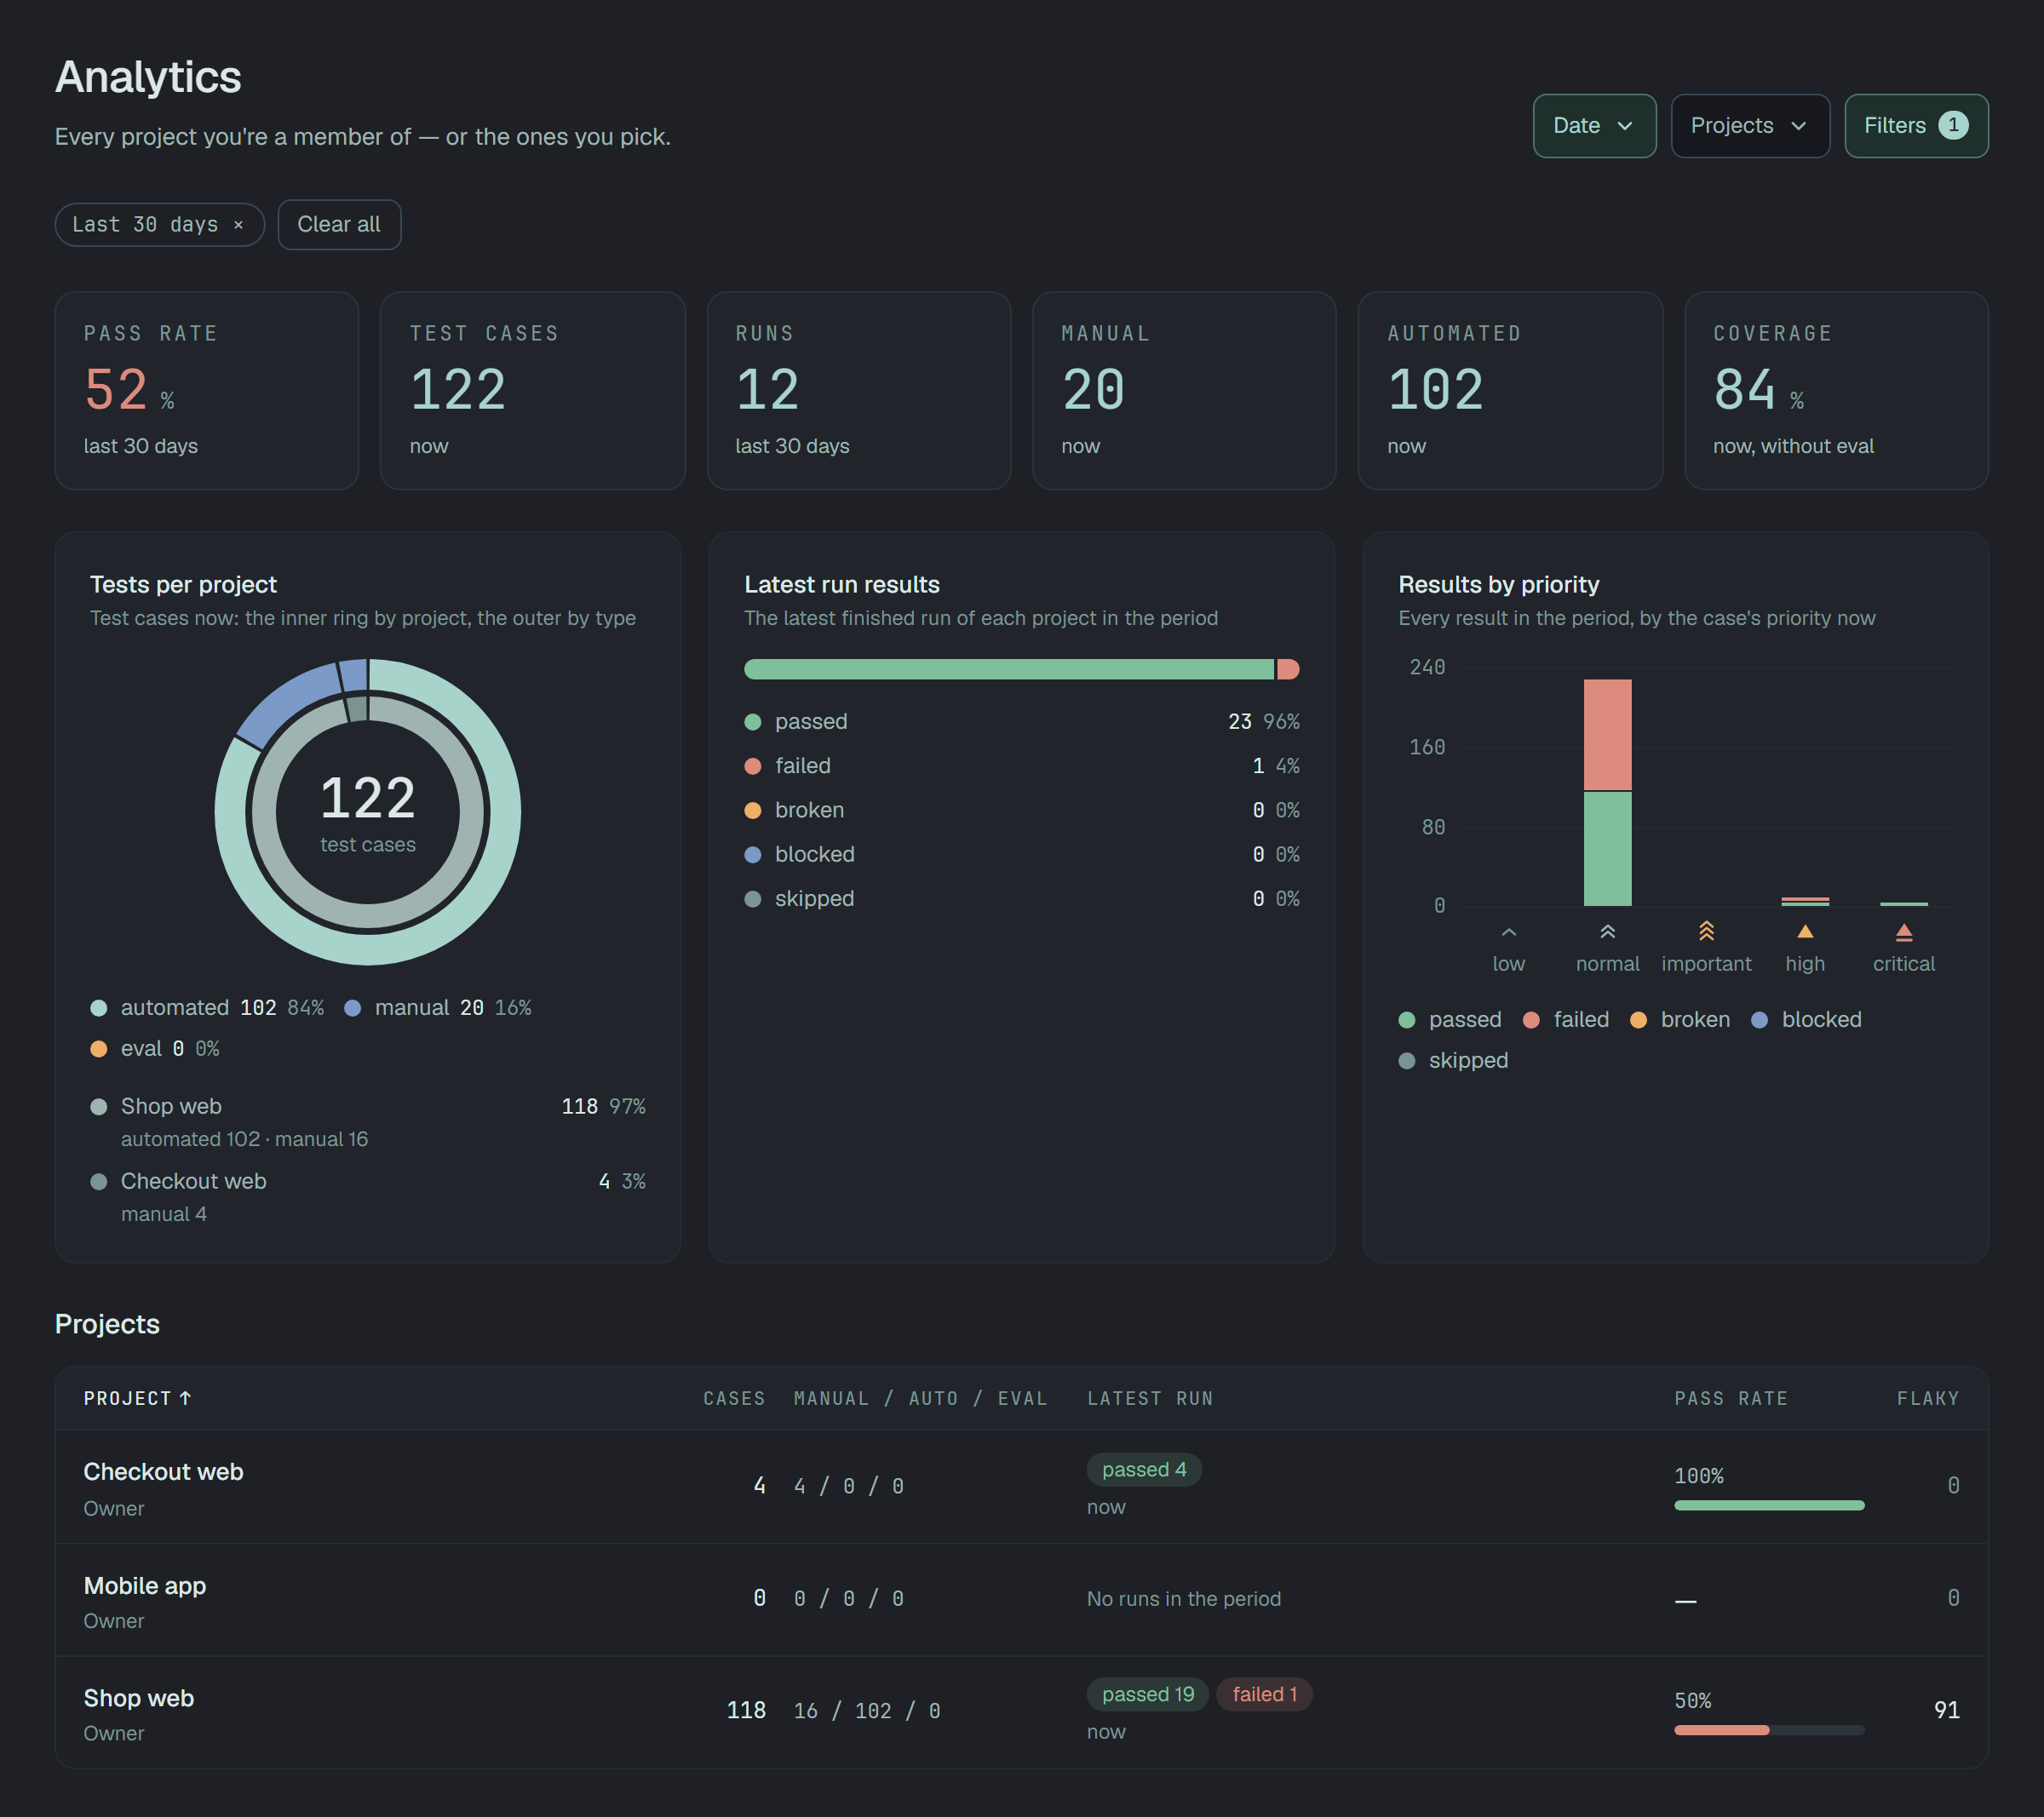
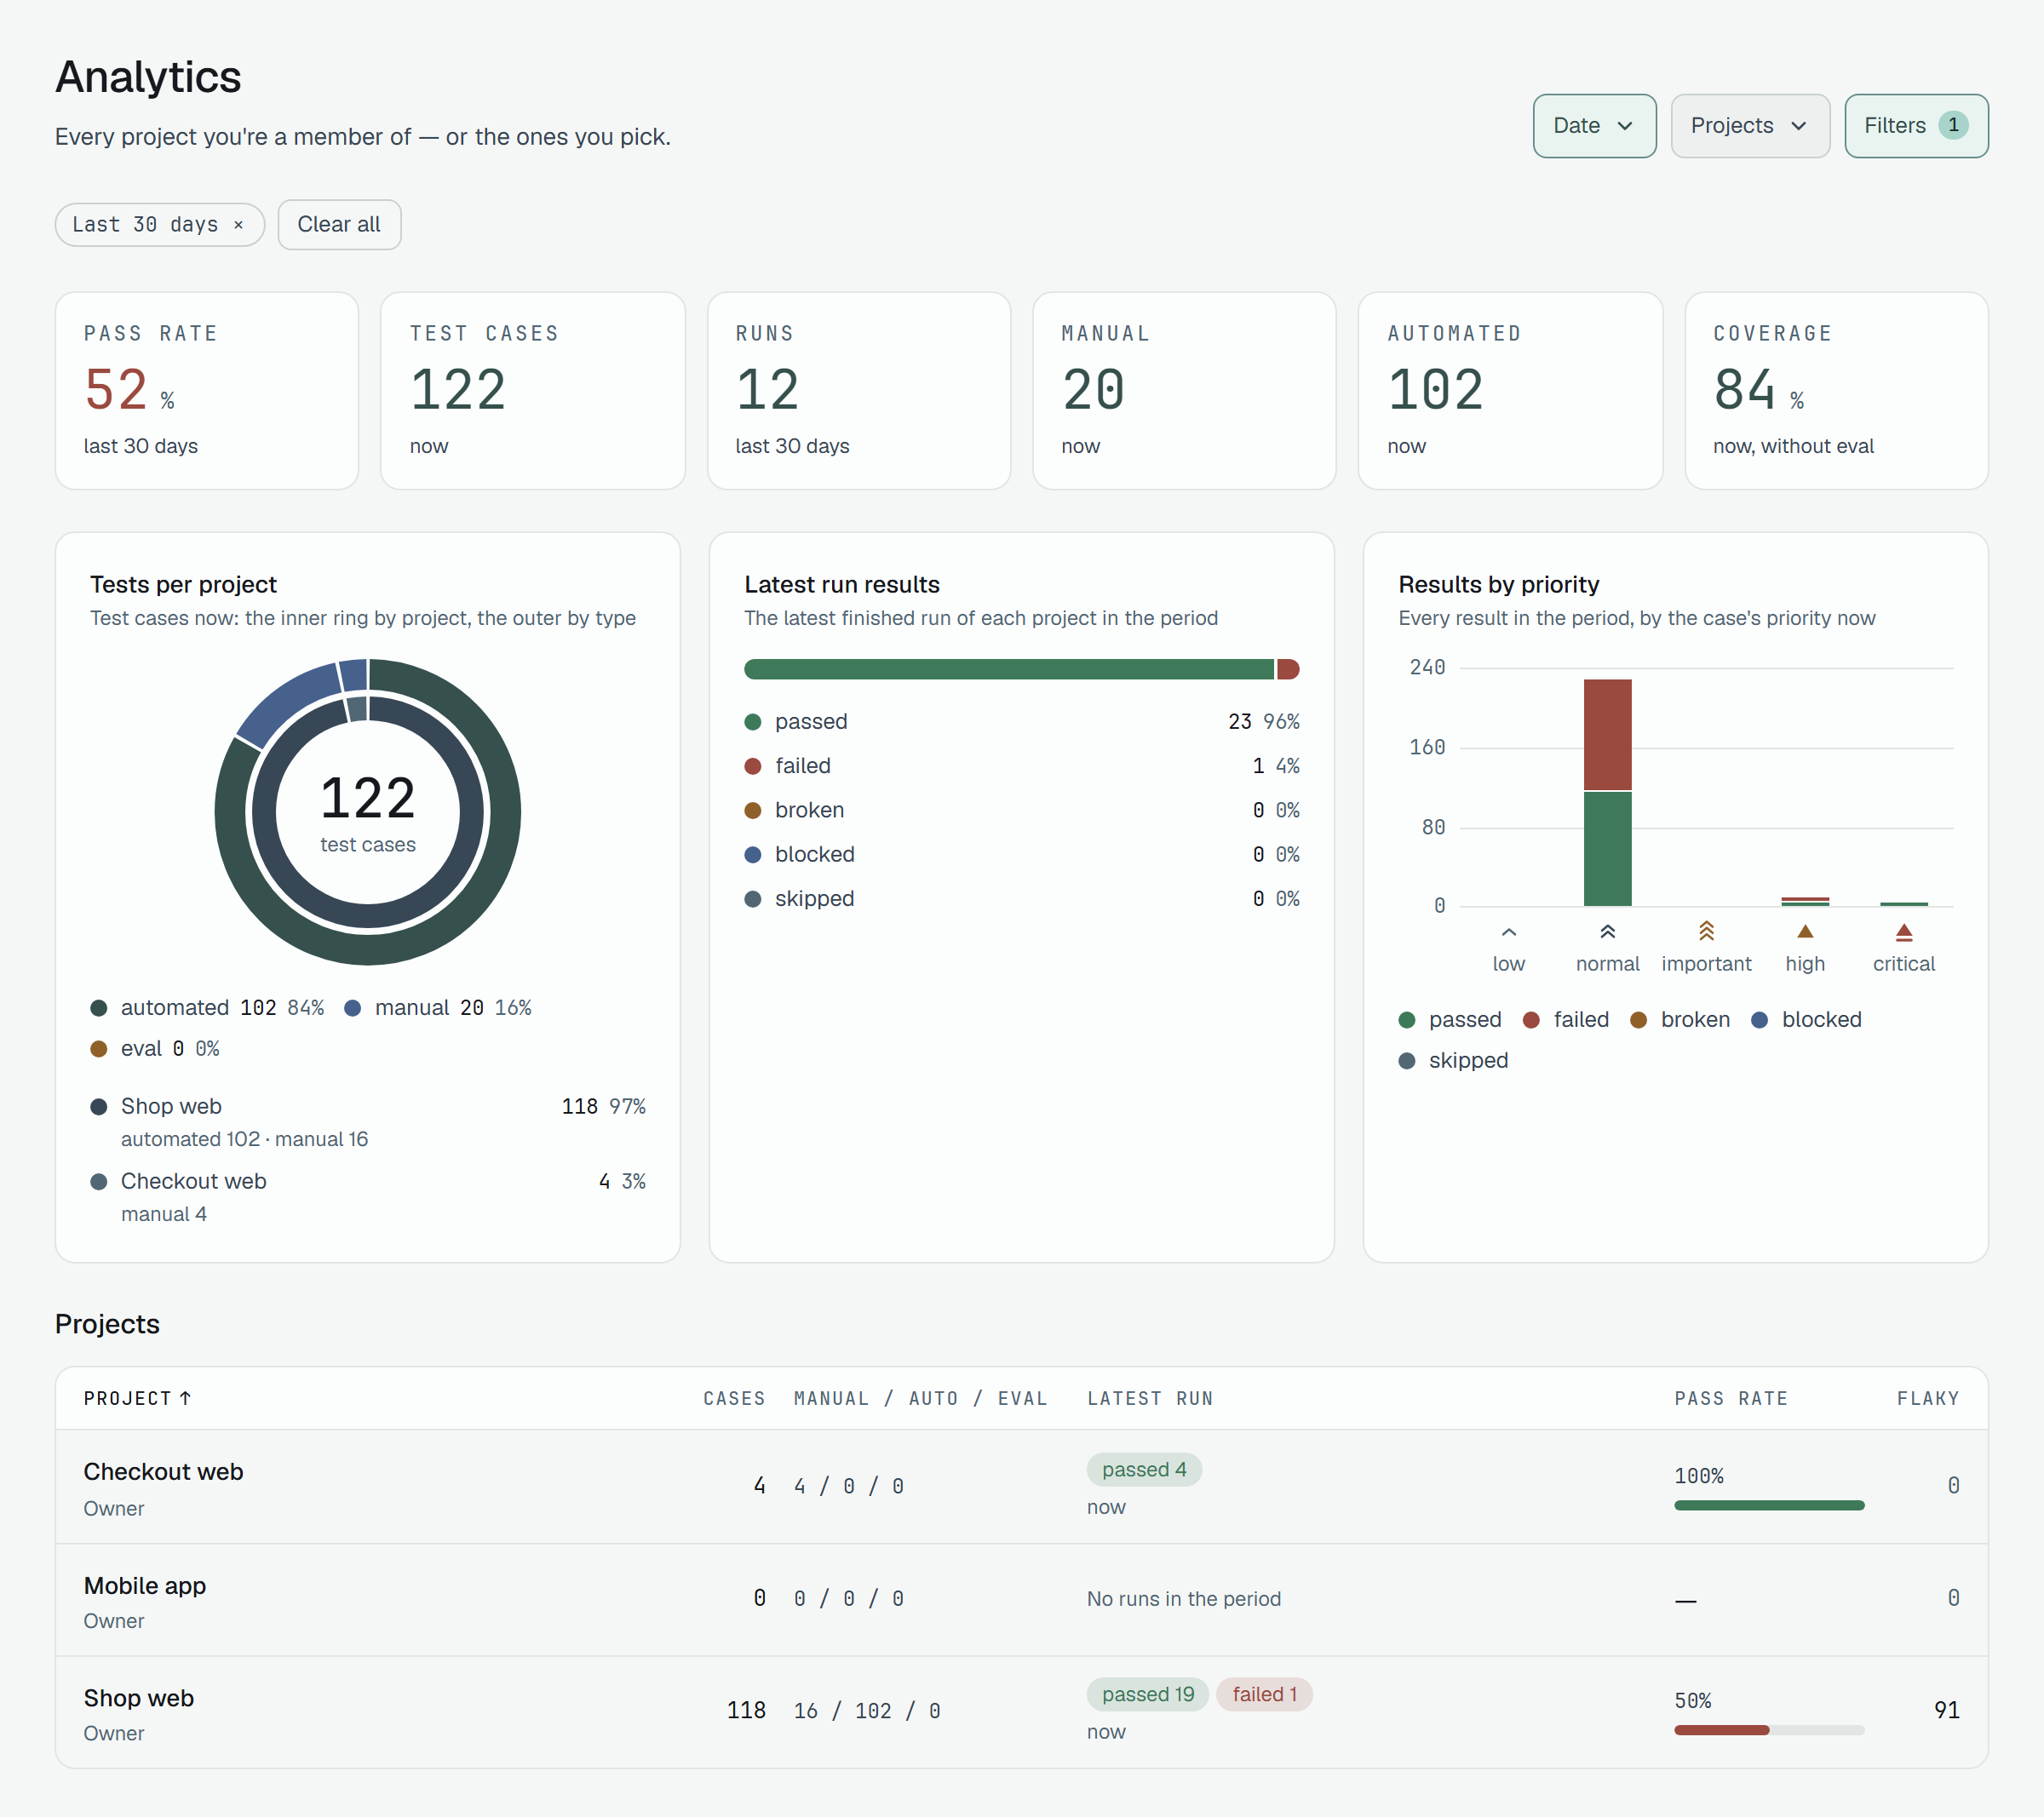
Section titled “The numbers”The six cards, in the words of the API that counts them:
| Card | What it counts |
|---|---|
| Pass rate | Passed ÷ every result of the period × 100 — skipped included. Shows — when the period has no result. |
| Test cases | Live cases now. The date does not act on them: it is what you have today, not what ran. |
| Runs | The runs of the period: started in it, finished or not, not in the Bin — and passing the run labels, environments and people picked. |
| Manual, Automated | Live cases now, of that type. |
| Coverage | Automated ÷ (manual + automated) × 100. An eval does not count: it replaces no manual test. Shows — with neither kind. |
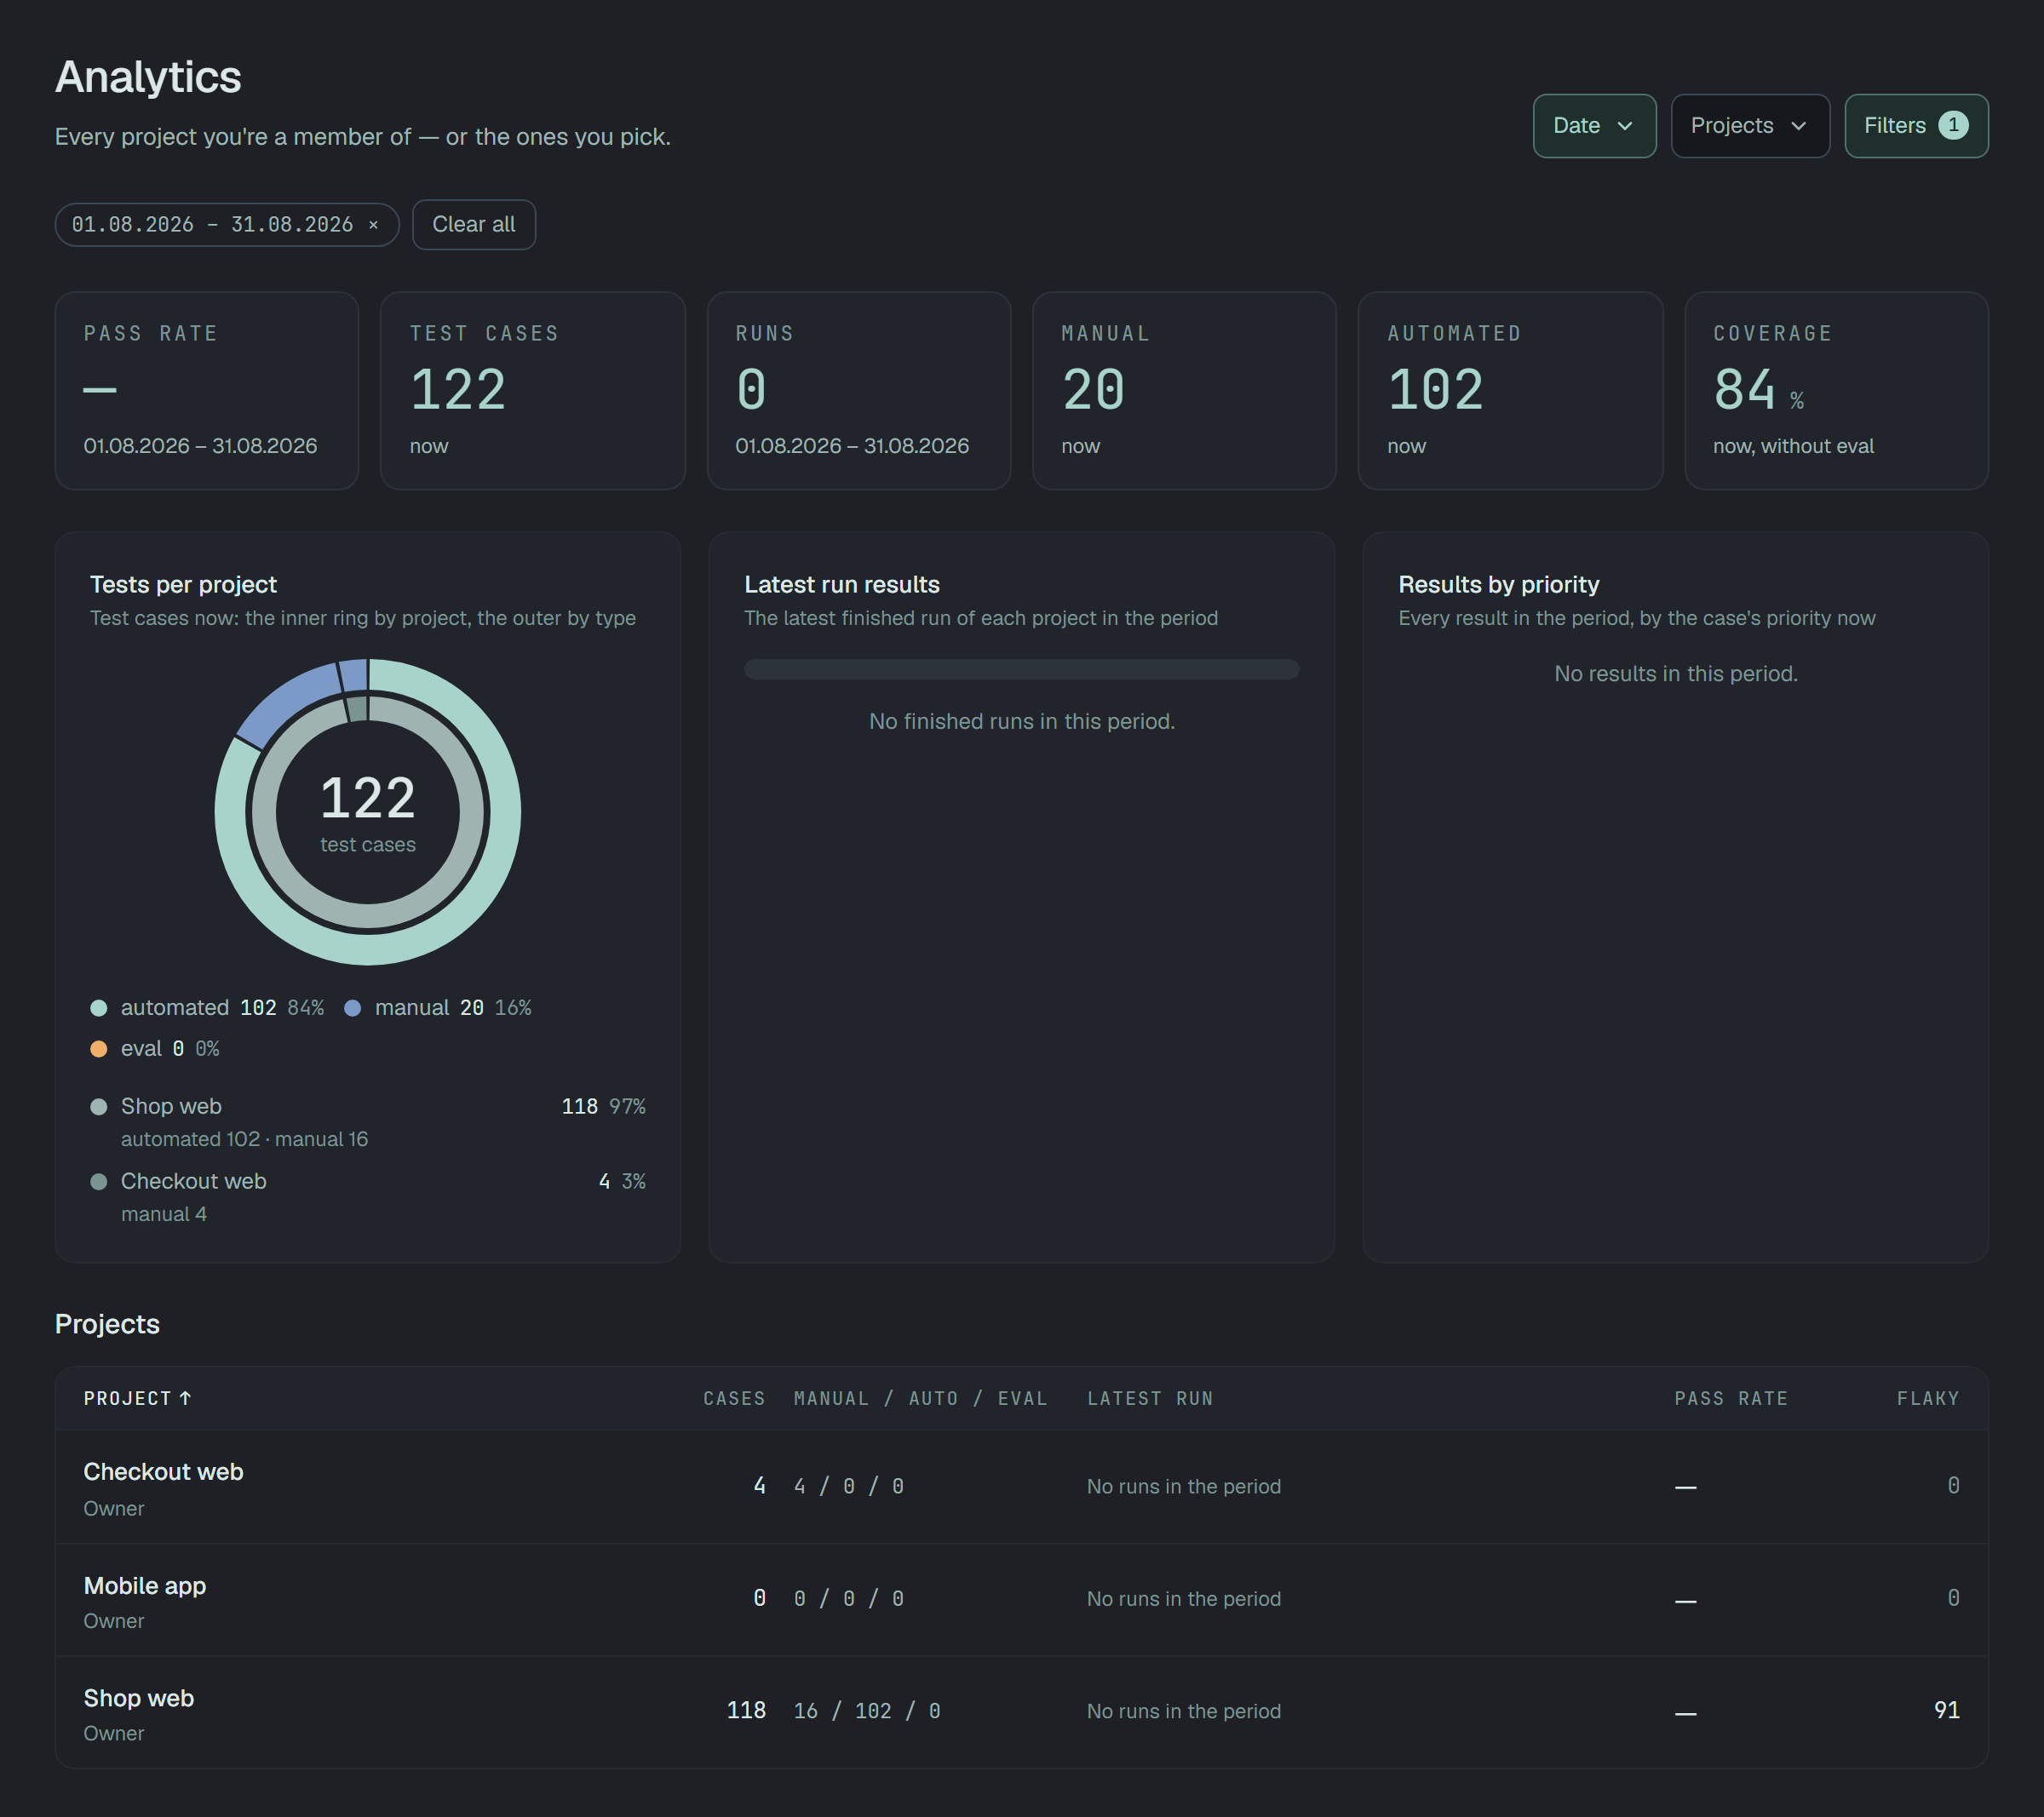
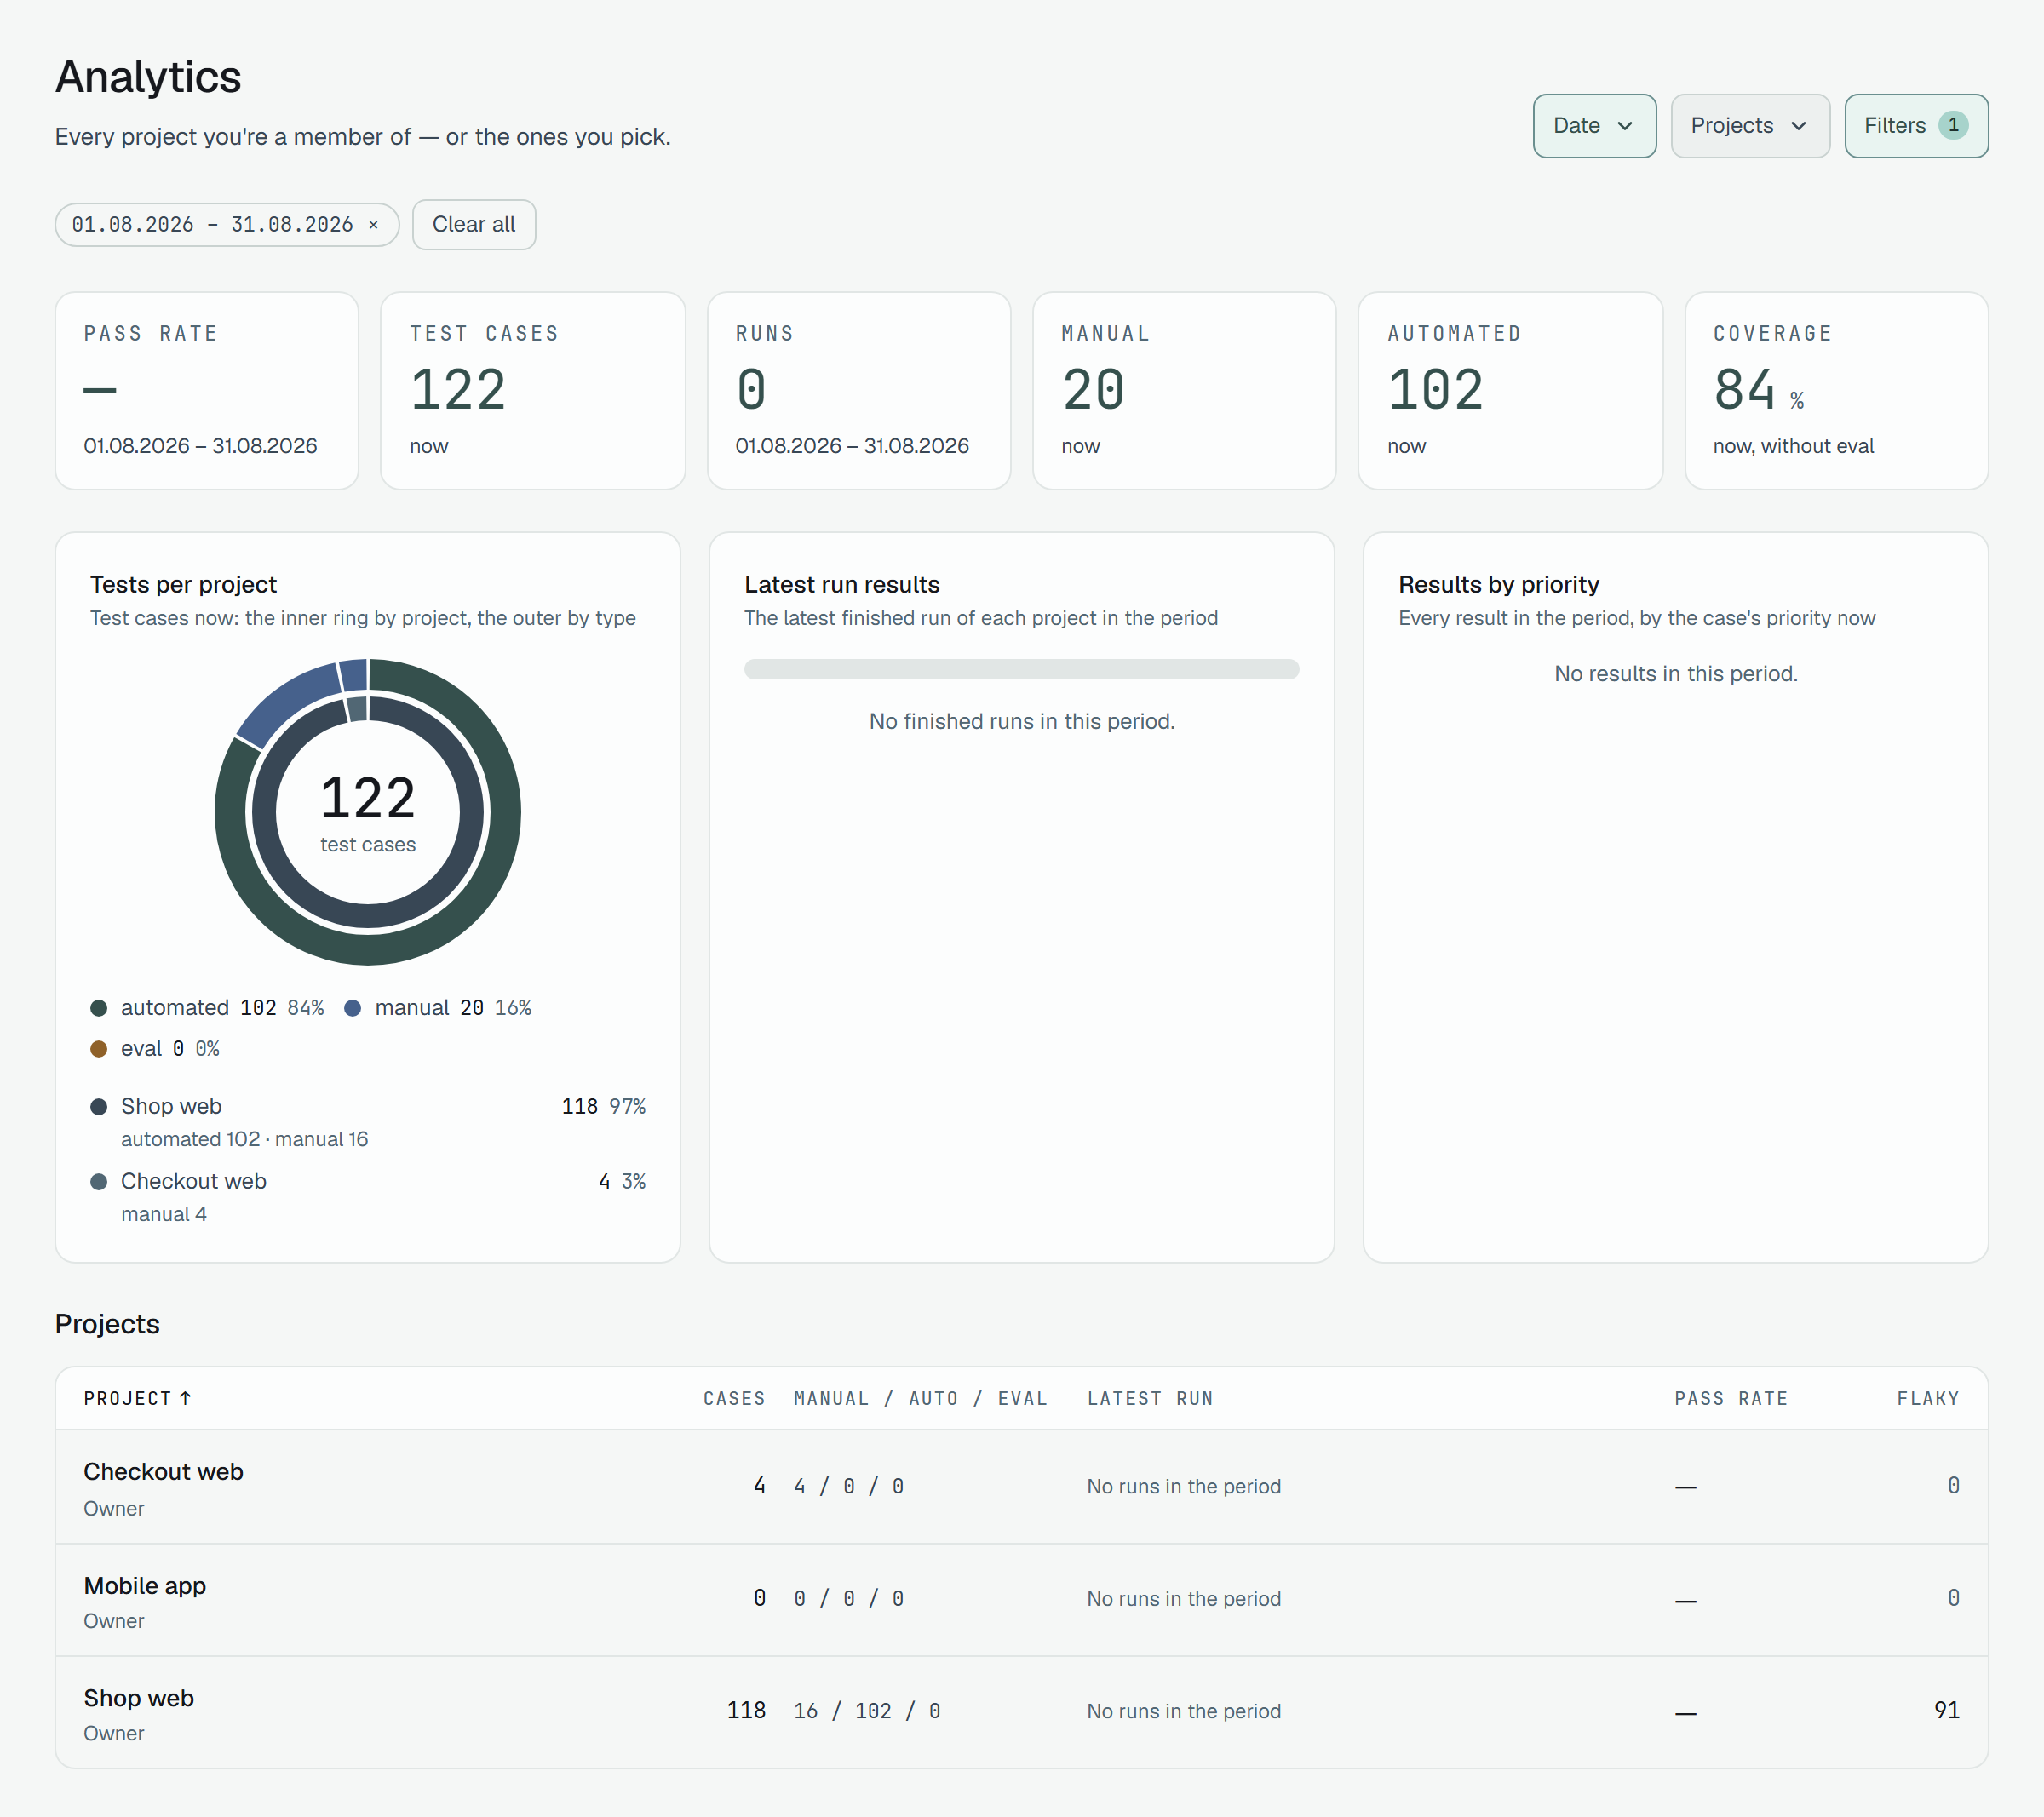
The note on each card says which: the period on Pass rate and Runs, now on the cases, now, without eval on Coverage — and Test cases adds how many of them are eval.
Over several projects the cards are the rows of the table added up: counts are summed, rates never averaged, so a project with a thousand results weighs a thousand times as much as one with a single result. The pass rate is shown in whole percent, but with one decimal within a point of either end — 0.4% is not «0%», 99.6% is not «100%». It is green from 90%, amber from 70% and red below.
What each filter acts on:
- Date, Run labels, Environment and Executed by choose runs, and with them results: Pass rate, Runs and the charts of results.
- Case tags and Suite or folder choose cases: the case counts, Coverage and Flaky narrow with them, and the results are those of the chosen cases.
- Projects choose everything.
In a period in which nothing ran, Pass rate is — and Runs 0, both charts of results say so, and every row of the table reads No runs in the period. The cases, Coverage and Flaky keep their numbers: the date does not act on them.
Reading the charts
Section titled “Reading the charts”Three charts stand between the cards and the table: one of the cases you have now, two of the results of the period.
Tests per project
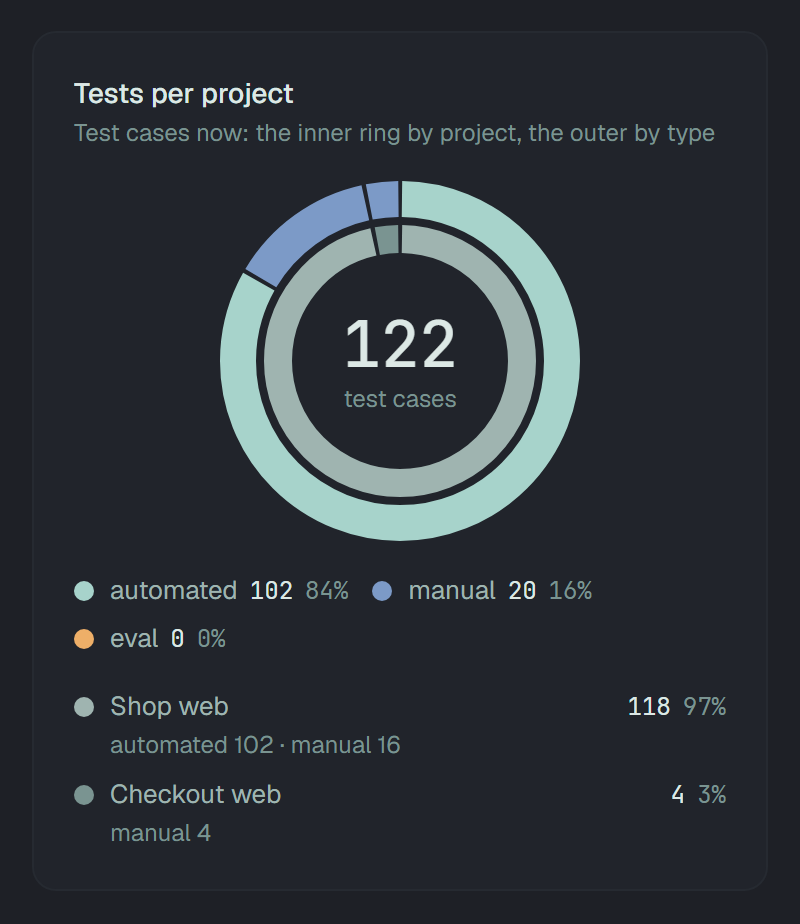
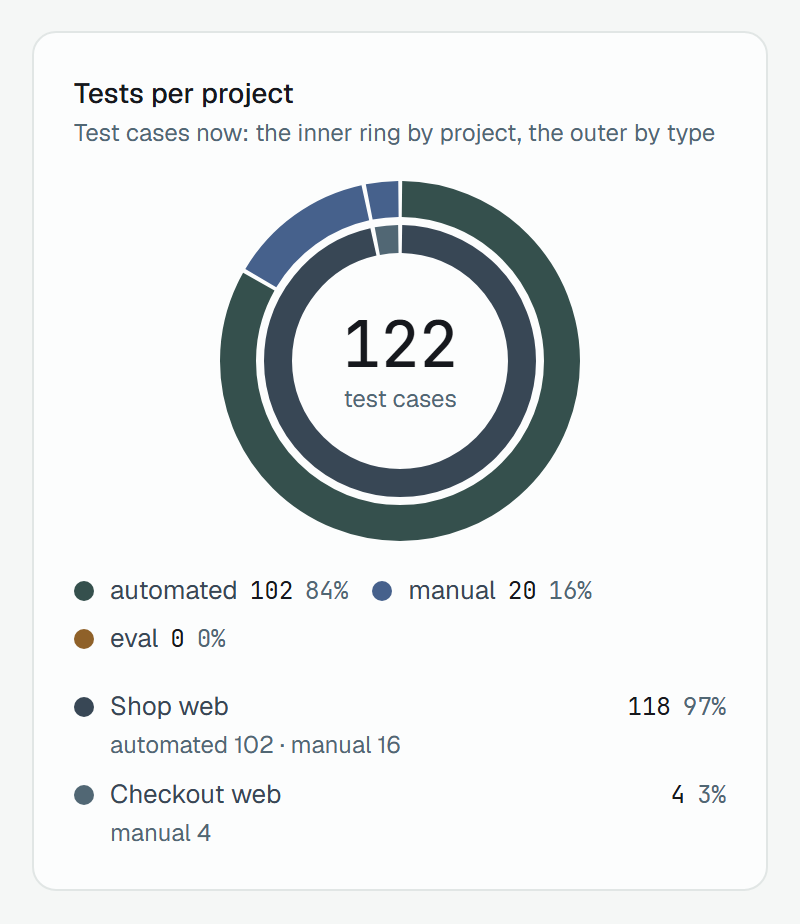
Section titled “Tests per project”The test cases you have now. The inner ring is a slice per project; the outer ring is the same slices cut by type — automated, manual, eval — and the middle is the total. Under it, each type with its count and share, then each project with its count, share and types. With more than six projects the five biggest keep their slices and the rest share one, Other N projects. A project with no cases has no slice.
Latest run results
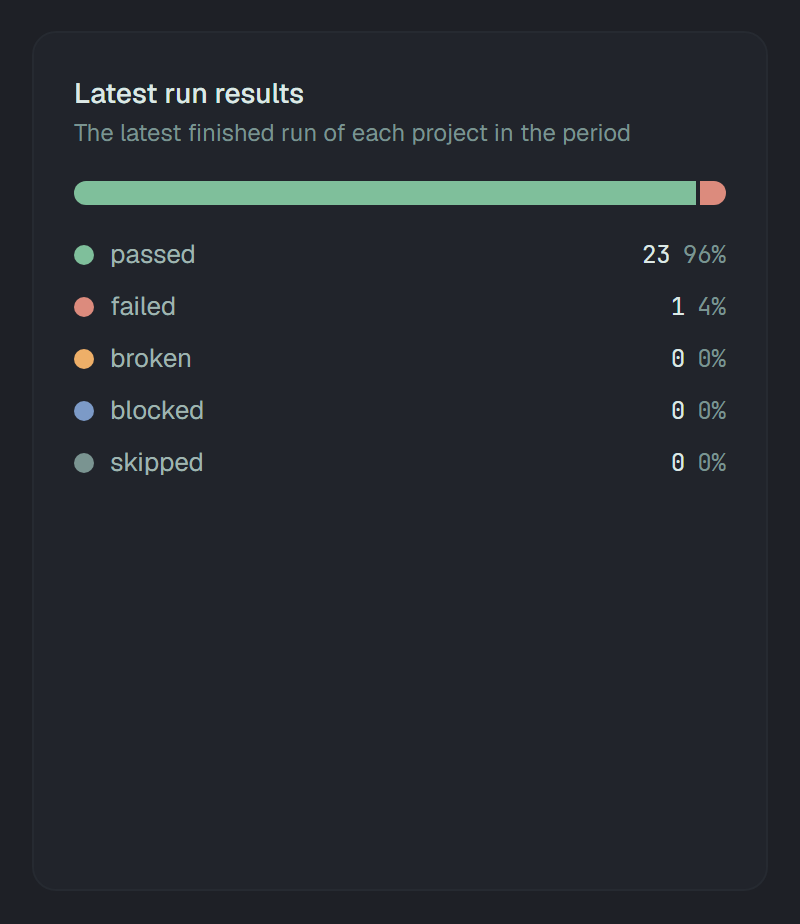
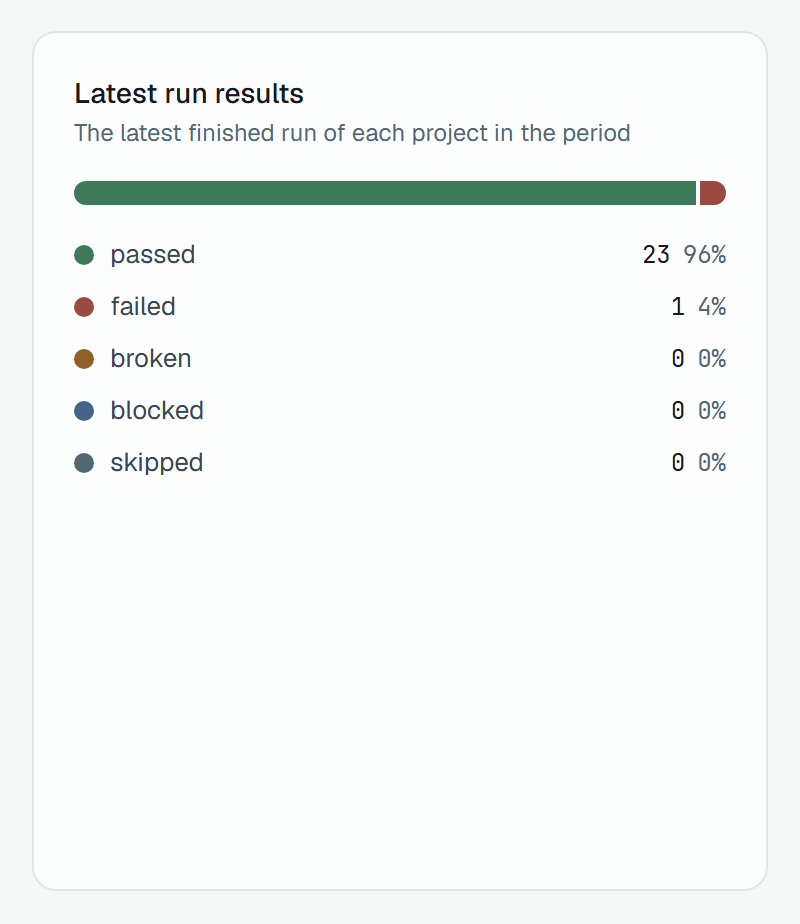
Section titled “Latest run results”The latest finished run of each project in the period — by when it finished; a run still going, or terminated, never counts — added up into one bar, split by status, and the five statuses with their counts and shares under it. A project with no finished run in the period adds nothing. For how things stand now, this is the chart to read; the Pass rate card is the whole period.
Results by priority
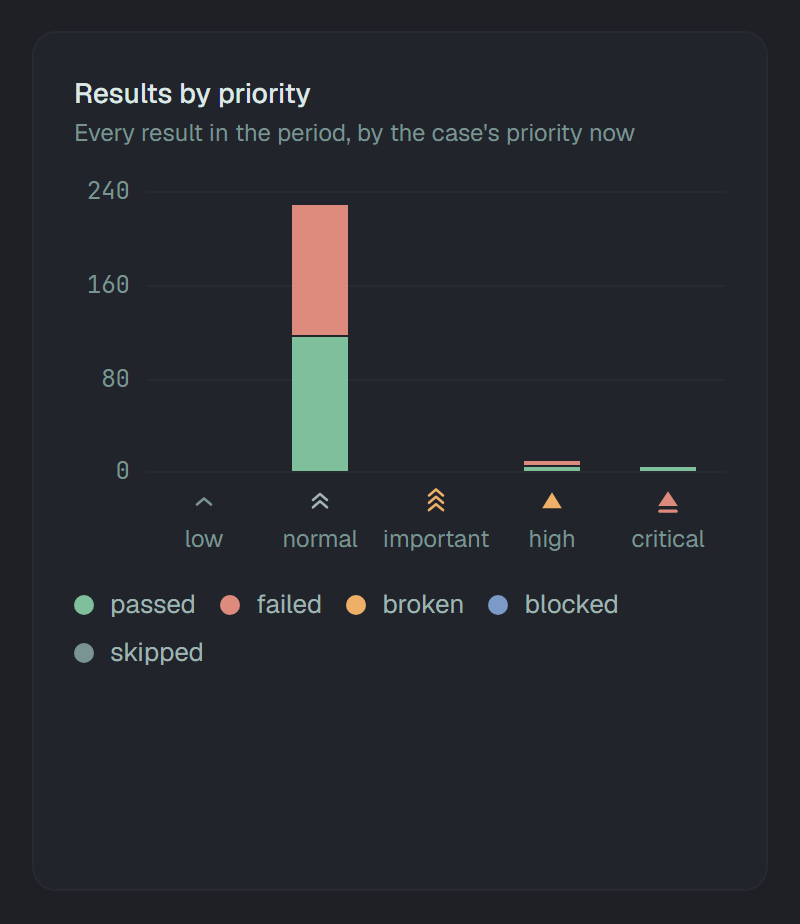
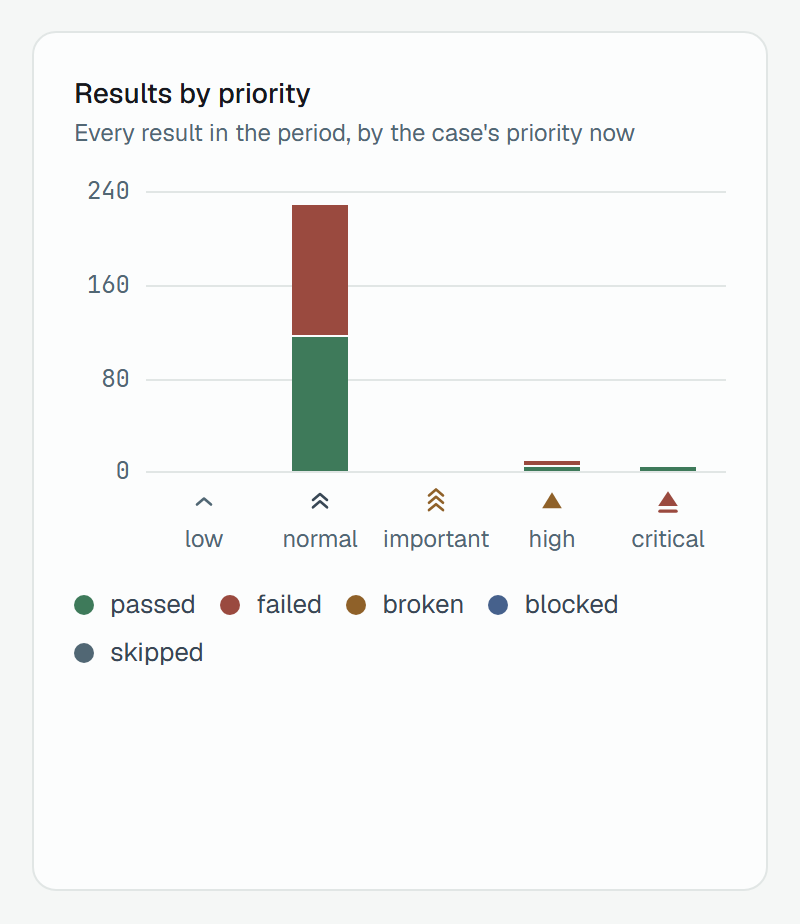
Section titled “Results by priority”Every result of the period, by the priority its case has now: a column per priority, from low to critical, split by status, on a scale at the left. A priority nobody ran is an empty place on the line. On a phone the columns turn into rows, each with its total at the end; a screen reader gets the numbers as a table.
The table of projects
Section titled “The table of projects”A row per project; a click anywhere on it opens the project’s runs.
| Column | What it holds |
|---|---|
| Project | The name, and your role in it. |
| Cases | Live cases now. |
| Manual / Auto / Eval | The same, by type. At 1024 px wide and narrower the column is left out. |
| Latest run | The statuses of the project’s latest finished run in the period, and when it finished — or No runs in the period. |
| Pass rate | The project’s pass rate over the period, with a bar in its colour. Shows — when the project has no result. |
| Flaky | The cases that flip between passing and failing — below. |
The table is sorted by name at first; Project turns the names around. Cases, Pass rate and Flaky sort from the most at the first click and from the least at the second; a project with no pass rate stays last either way. Of two projects with one name, your own comes first. On a phone the numbers fold into one line under the name — «118 cases · 50% passed · 91 flaky».
Flaky counts the project’s live cases whose stability is flaky or very flaky — the badge the cases list shows. Stability reads the last 50 results of each case and counts how often a pass turned into a failure — not how often it failed. A case that failed its last ten runs is broken, not flaky: its stability is stable. One turn into failure per ten results makes a case flaky; three, very flaky. Skipped and blocked results are left out, a broken one is a failure, and failures before the first pass do not count.
Stability is the history of each case, so neither the period nor run labels, environment or executed by act on Flaky: a quiet month keeps the number, as in the empty period above. Case tags and suite or folder do narrow it — they choose the cases.
Comparing two projects
Section titled “Comparing two projects”-
Click Projects and tick the two, as in the picture above. Each tick applies at once.
-
Press Esc. The cards and charts now add up the two, and the table has a row for each.
-
Click Pass rate — or Flaky — to put them in order.
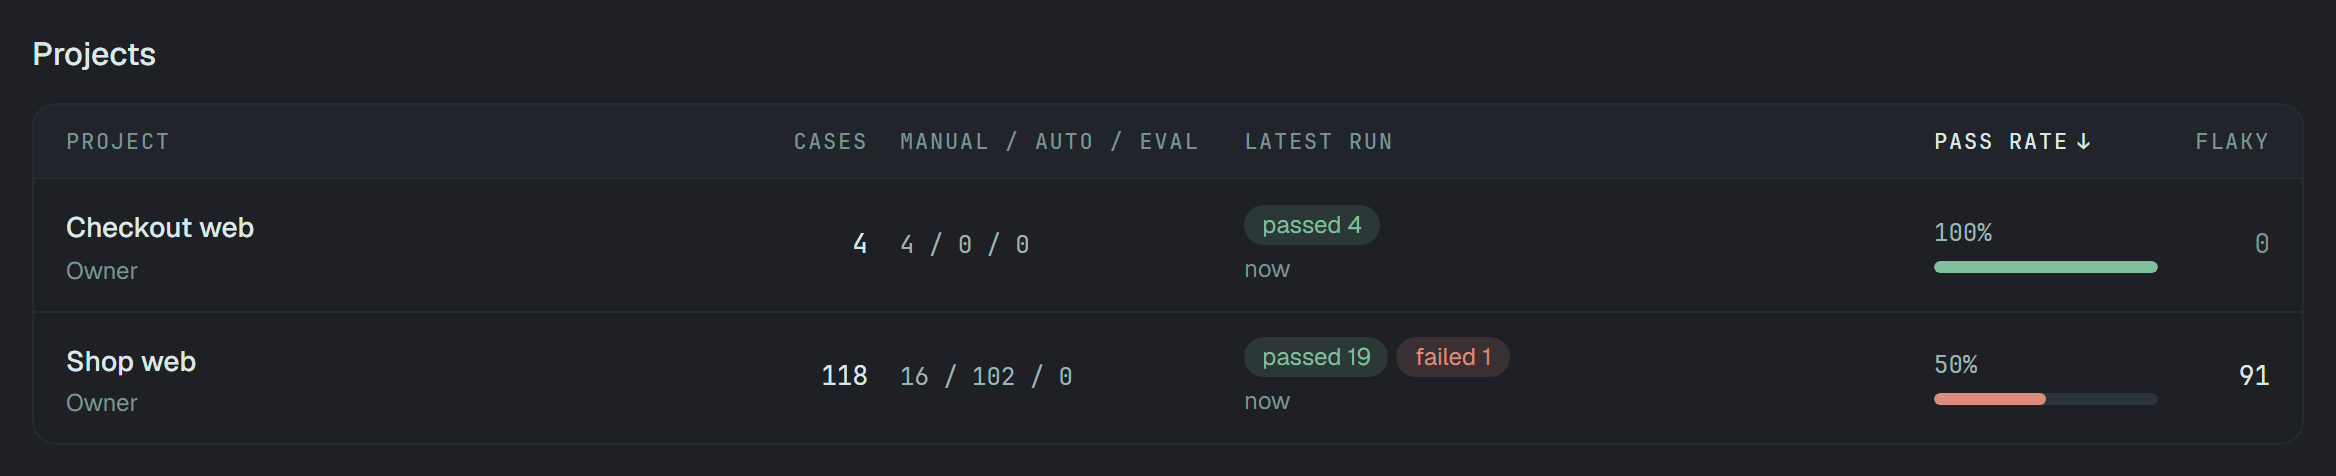
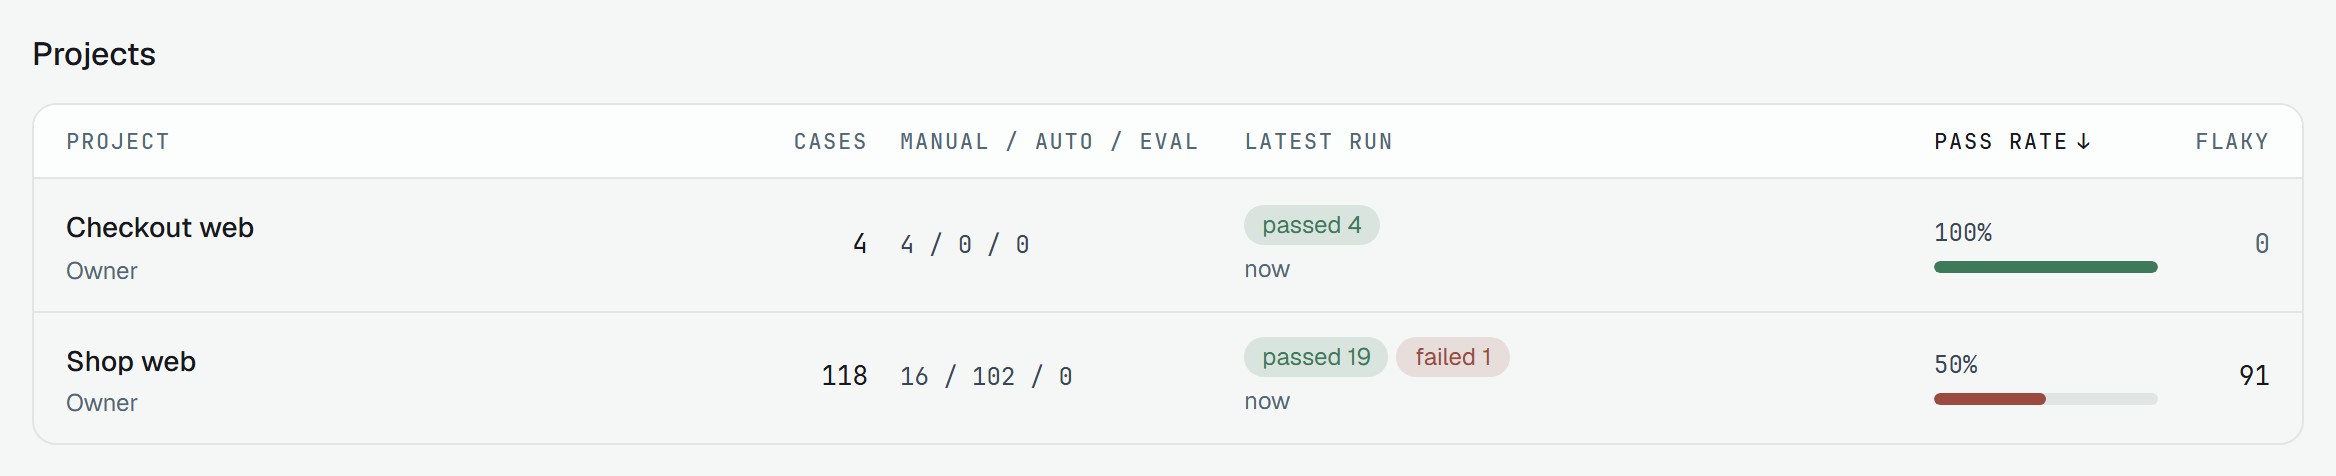
Two projects side by side, sorted by Pass rate. -
To show someone the comparison, send the address — it holds both projects.
Through the API
Section titled “Through the API”GET /v1/analytics answers the whole page in one request, with the same numbers counted the same way.
With a token:
curl -H "Authorization: Bearer $PLUNE_TOKEN" \ "https://beta-api.plune.ai/v1/analytics?from=2026-09-01T00:00:00Z&to=2026-09-30T23:59:59Z"A token reads only its own project — the one it was minted for in
Account → API tokens — and naming any other in projects answers
404. Several projects at once are for your session, in the dashboard.
The answer, shortened — the sample project Shop web over September:
{ "range": { "from": "2026-09-01T00:00:00.000Z", "to": "2026-09-30T23:59:59.000Z" }, "kpis": { "passRate": 49.8, "cases": 118, "runs": 10, "manual": 16, "automated": 102, "eval": 0, "coverage": 86.4 }, "latest": { "passed": 19, "failed": 1, "broken": 0, "blocked": 0, "skipped": 0 }, "byPriority": [ { "priority": "low", "passed": 0, "failed": 0, "broken": 0, "blocked": 0, "skipped": 0 }, { "priority": "normal", "passed": 108, "failed": 111, "broken": 0, "blocked": 0, "skipped": 0 }, { "priority": "important", "passed": 0, "failed": 0, "broken": 0, "blocked": 0, "skipped": 0 }, { "priority": "high", "passed": 2, "failed": 1, "broken": 0, "blocked": 0, "skipped": 0 }, { "priority": "critical", "passed": 1, "failed": 0, "broken": 0, "blocked": 0, "skipped": 0 } ], "projects": [ { "id": "…", "name": "Shop web", "role": "owner", "cases": { "manual": 16, "automated": 102, "eval": 0 }, "latestRun": { "id": "…", "finishedAt": "2026-09-29T09:29:20.519Z", "counts": { "passed": 19, "failed": 1, "broken": 0, "blocked": 0, "skipped": 0 } }, "passRate": 49.8, "flaky": 91 } ], "facets": { "labels": [{ "value": "smoke", "runs": 1 }], "tags": [{ "value": "api", "cases": 3 }, { "value": "smoke", "cases": 3 }, …], "environments": [{ "value": "prod", "runs": 4 }, { "value": "ci", "runs": 3 }], "people": [{ "userId": "…", "name": null, "email": "…" }, …] }}| Field | What it holds |
|---|---|
range | The period the numbers are for — from and to as UTC instants; null is no bound. |
kpis | The six cards: passRate (one decimal; null — no result), cases, runs, manual, automated, eval and coverage (null — neither manual nor automated). They are the rows of projects added up. |
latest | The counts of every projects[].latestRun, added up — the bar of Latest run results. |
byPriority | Five rows, low to critical: the results of the period by their case’s priority now. A priority nobody ran is a row of zeros. |
projects | A row per project: id, name, your role, cases by type, latestRun — the last finished run of the period, with finishedAt and its counts, or null — then passRate and flaky. |
facets | The values the filters offer, from the projects alone: labels and environments with how many runs of all time carry each, tags with how many live cases, and people — the projects’ members, whose userId is what executedBy takes. |
The parameters, beside the page’s own keys:
| Parameter | On the page | |
|---|---|---|
from, to | from, to, period | Date-times with their zone, both ends included. Without one, the period has no start or no end. |
projects | projects | Ids, comma-separated or repeated; at most 100. Without it, every project you are in. |
labels | labels | Repeated for any of. |
tags | tags | Without @; repeated for any of. |
environments | env | Repeated for any of. |
executedBy | by | User ids, comma-separated or repeated. |
suite | suite | One suite or folder, with exactly one project. |
Write the zone as Z — or the + of an offset as %2B: in an address a bare + reads as a space, and
the answer is 400. The other 400s: from later than to, suite without exactly one project, more
than 100 projects. A project you are not in, or one in the Bin, is 404 — the same answer as an id
nobody has. The endpoint, with its schema and an example, is in the
API reference.
A step that reads the week’s pass rate and fails the job below 90%:
- name: The week's pass rate is 90% or more env: PLUNE_TOKEN: ${{ secrets.PLUNE_TOKEN }} PLUNE_API_URL: https://beta-api.plune.ai run: | from=$(date -u -d '7 days ago' +%Y-%m-%dT%H:%M:%SZ) curl -fsS -H "Authorization: Bearer $PLUNE_TOKEN" \ "$PLUNE_API_URL/v1/analytics?from=$from" > analytics.json jq .kpis analytics.json jq -e '.kpis.passRate >= 90' analytics.jsonThe numbers are the token’s project’s. jq -e ends with an error when the comparison is false — a pass
rate under 90%, or no result in the week at all, null — and the step fails with it. Put the step after
the one that reports the run, so that run is in the week.
Questions
Section titled “Questions”Why does Analytics say something different from Trends? Trends is one project’s runs, one by one, and its Pass rate · latest is the last run alone. Analytics adds up every result of the period — over a month, the last run is one of many. The closest thing here to Trends’ last run is Latest run results.
Why does Coverage leave eval out? Coverage is how much of what people would otherwise test by hand is automated: automated ÷ (manual + automated). An eval checks a model’s output and replaces no manual test, so counting it would raise Coverage without taking any testing off anyone’s hands. Test cases and the donut count eval cases all the same.
Why doesn’t Flaky change with the period? It is each case’s own history — its last 50 results — not what happened in the period. See Flaky.
Why are there no defects? Plune does not keep defects yet. When it does, Analytics will count them too.
Why can’t I pick a company? Companies are in the API, not yet in the dashboard. When they reach it, a company will narrow Analytics to those of its projects you are a member of — a company role alone opens none.
Why is a project missing? You are not a member of it, or it is in the Bin — see What the page shows.